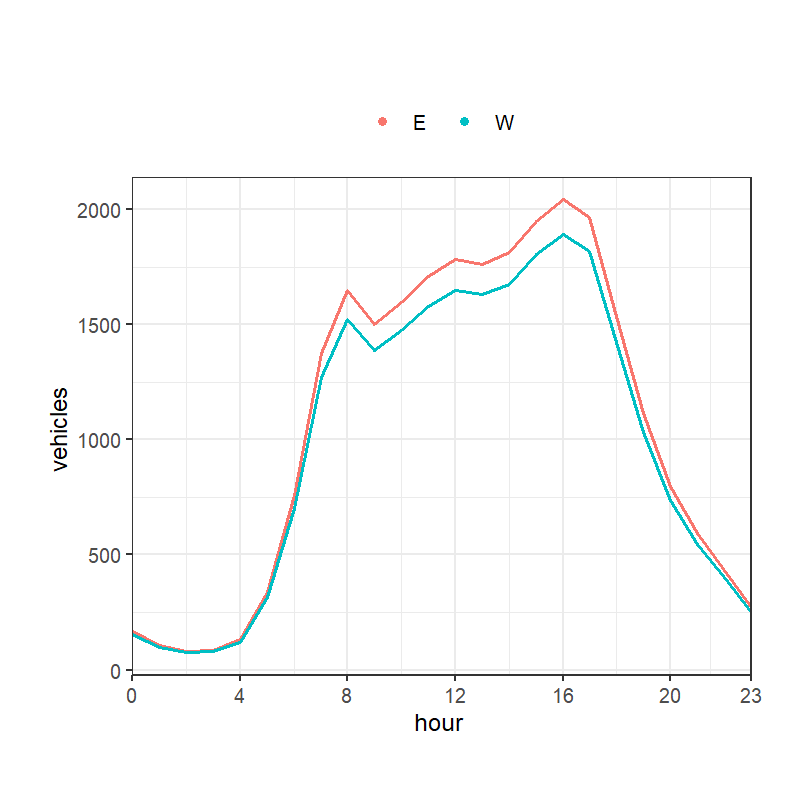
Analysis of speed, noise and TAG costs for the B3108 in Wiltshire.
Comparing CAMS forecasts against monitoring data during the wildfires in North-West England in early July.
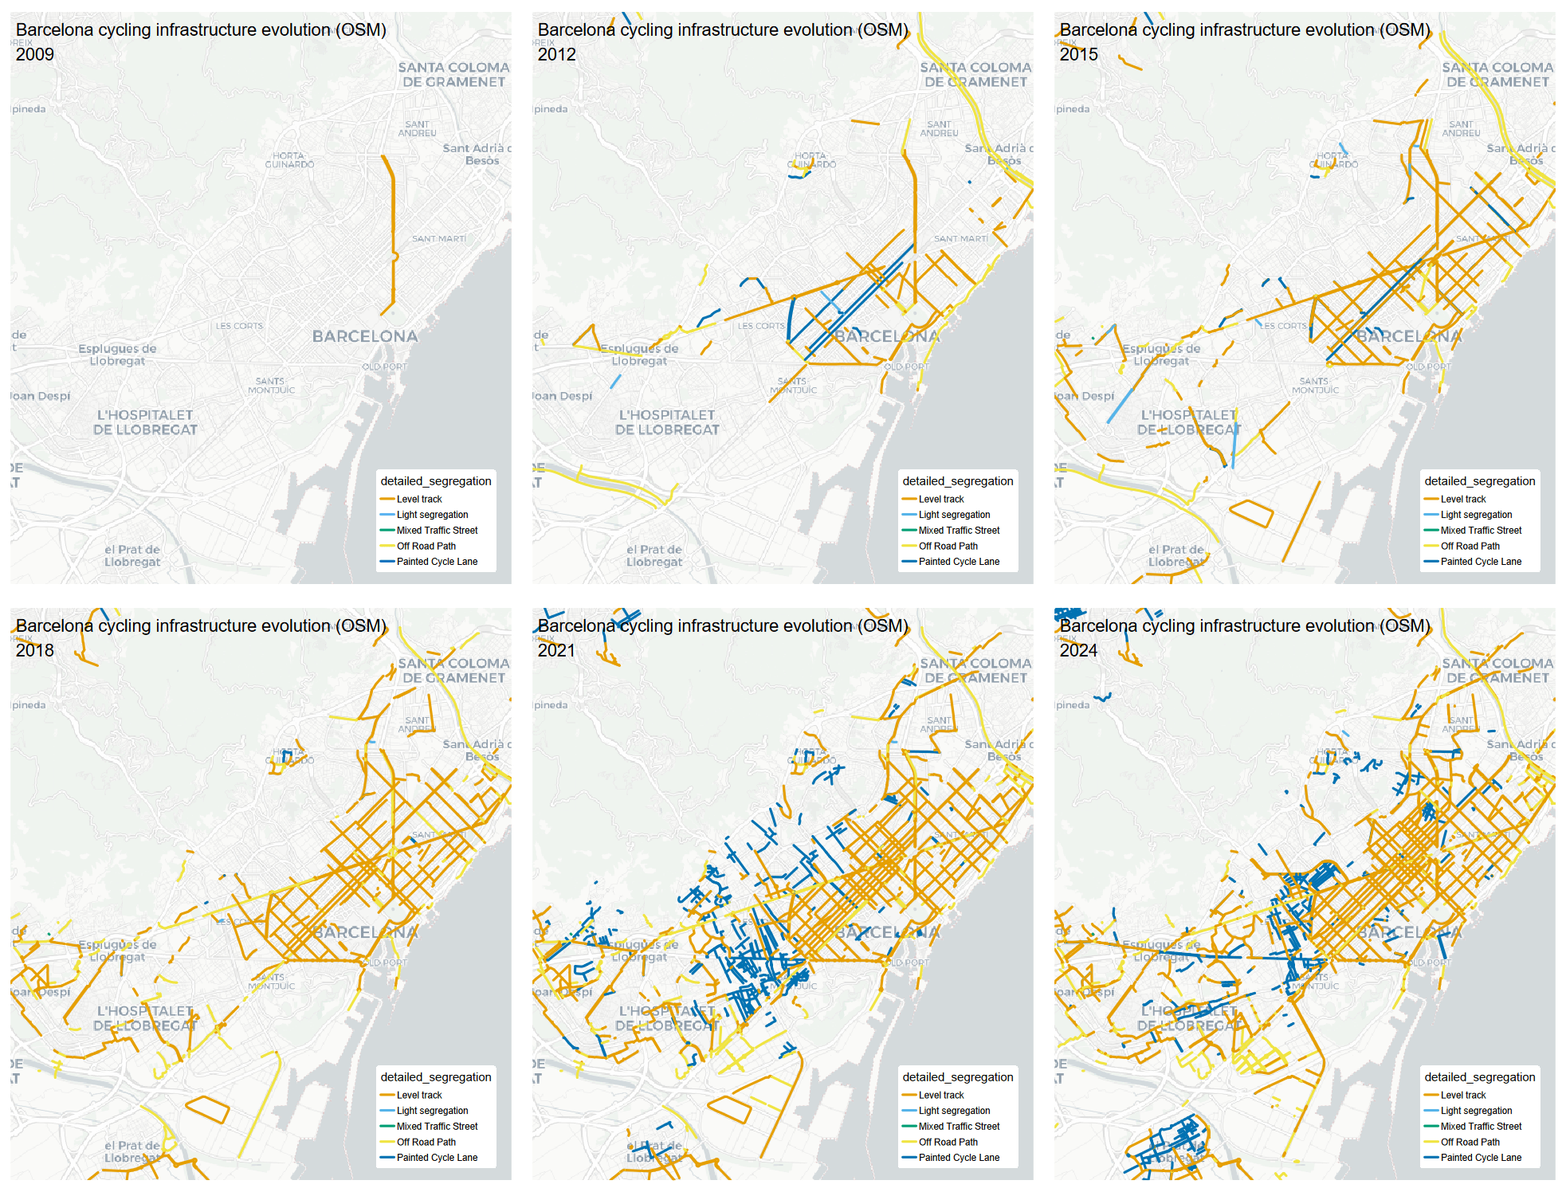
Analysis of local air quality observation data and cycle infrastructure from OSM before a study week in the city.
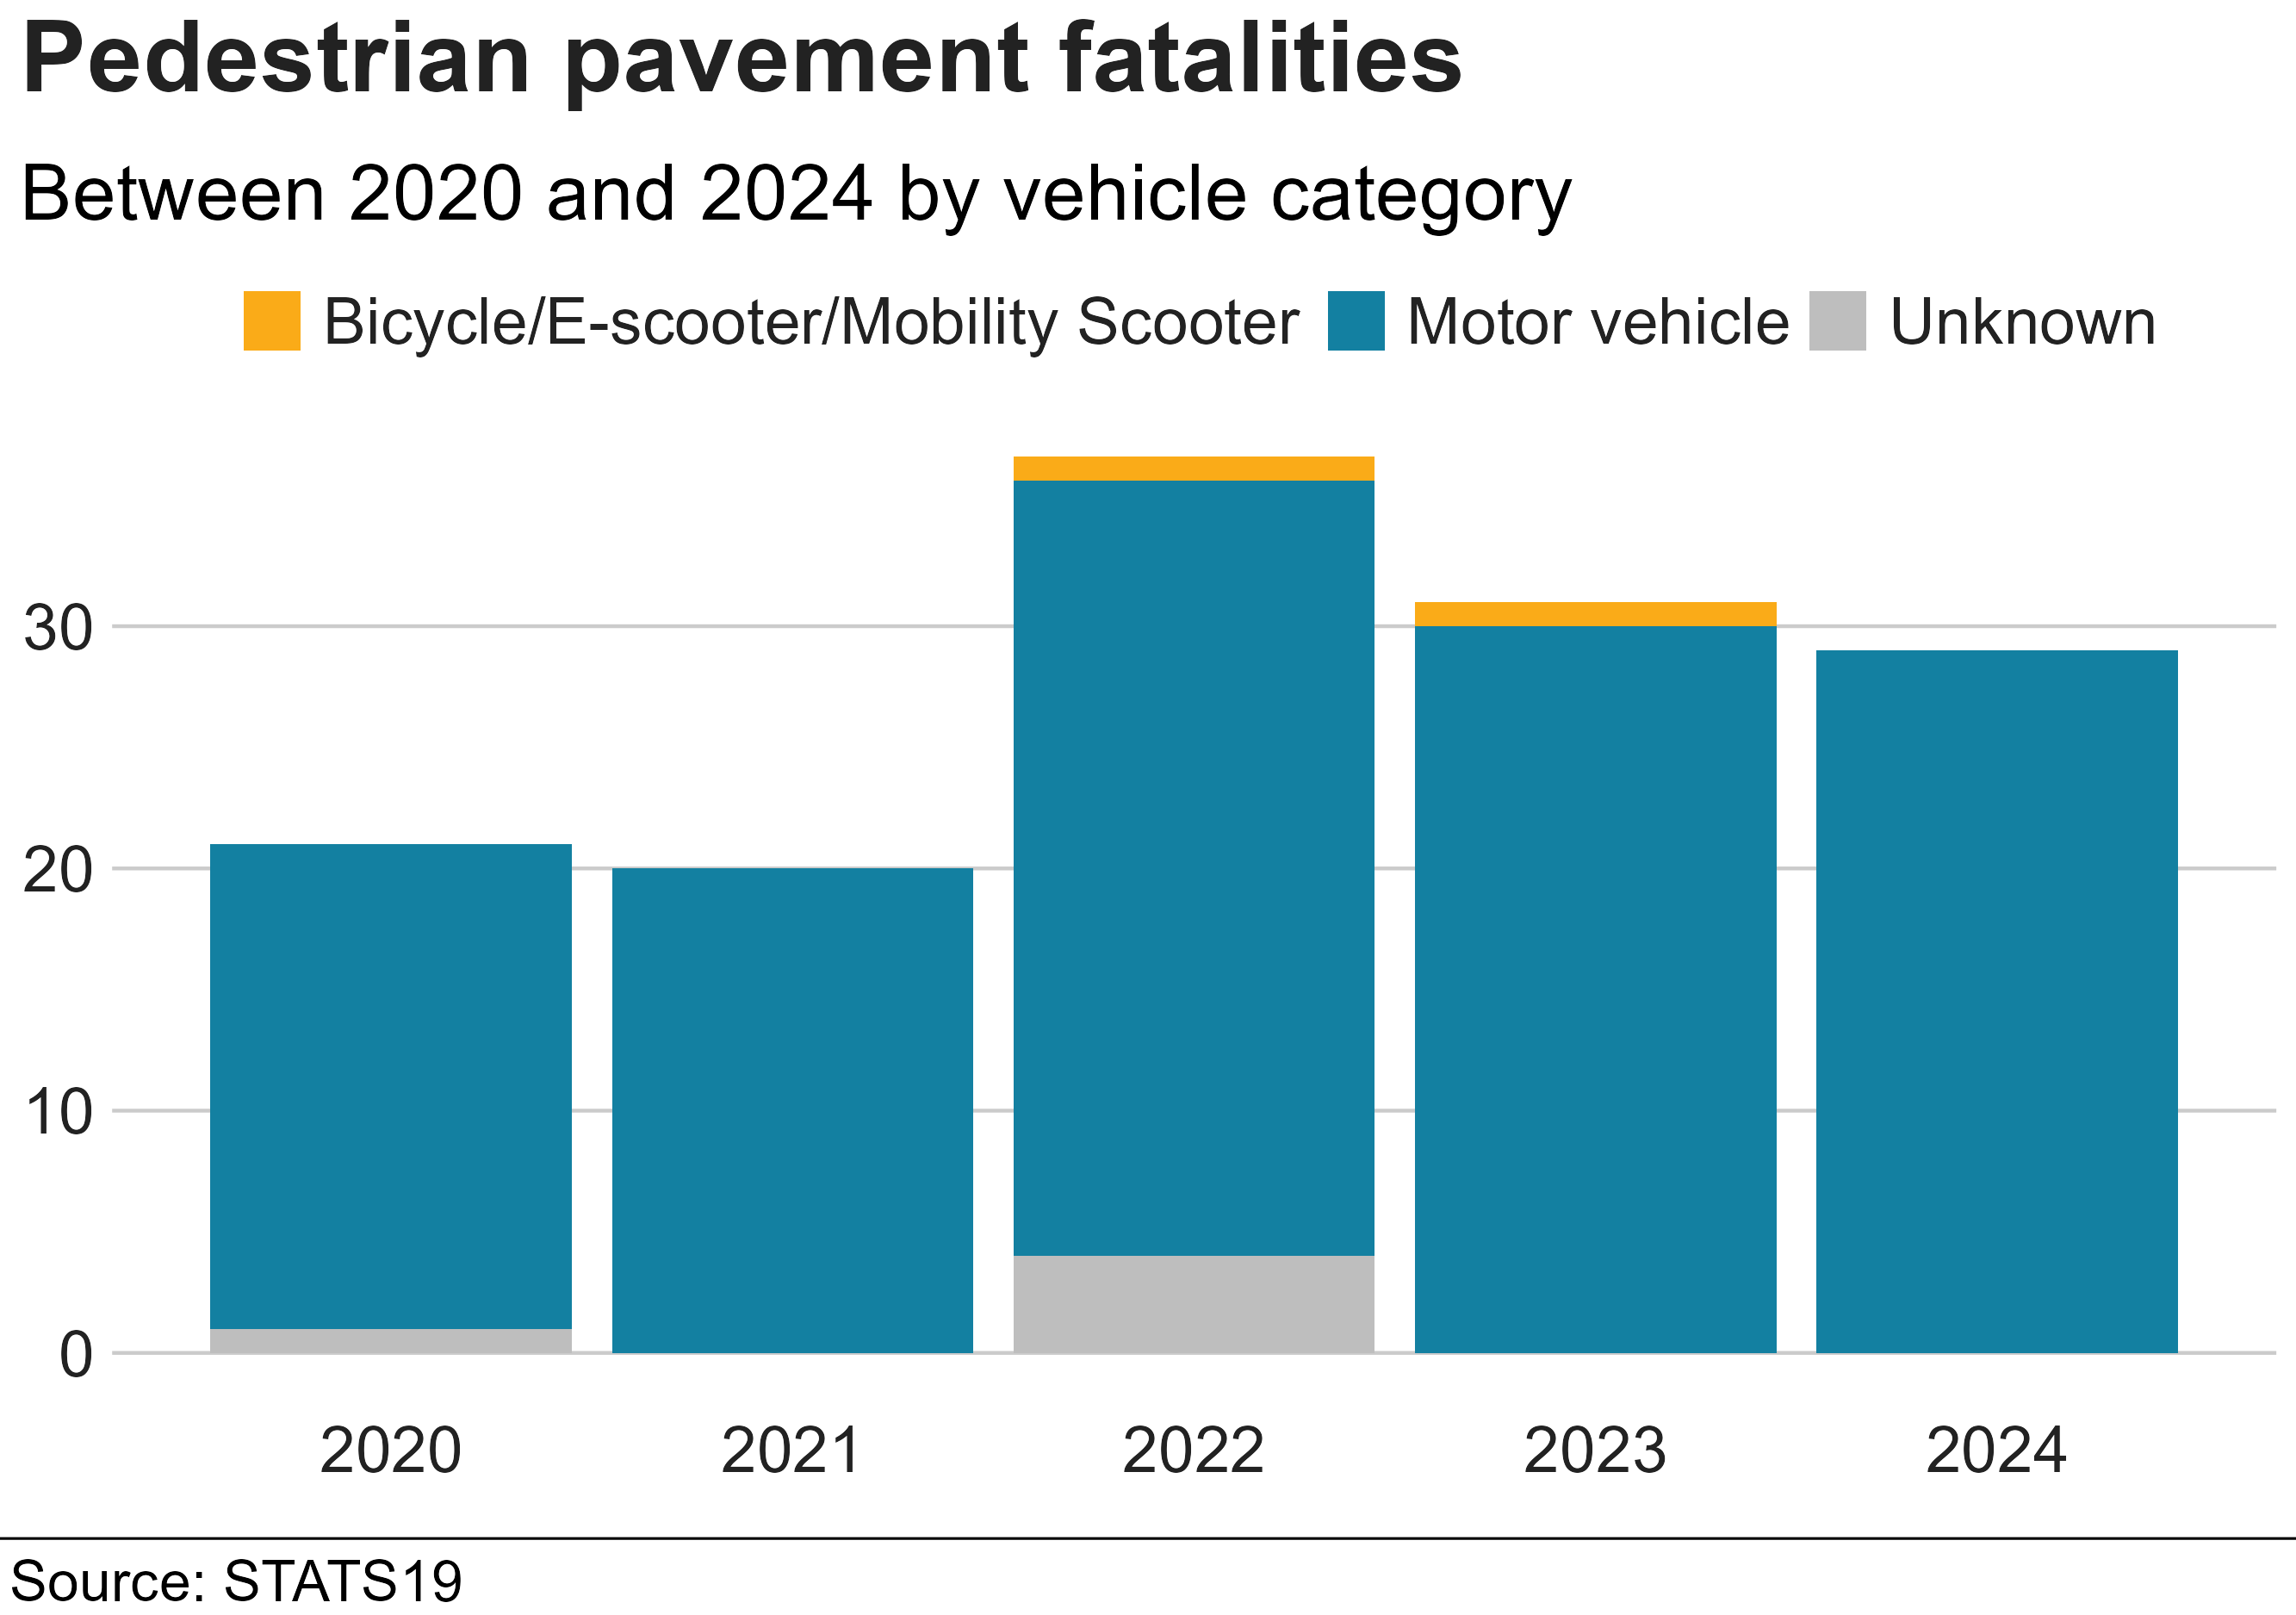
Reproducible analysis and plots of pavement pedestrian fatalities from STATS19 data covering Great Britain. Plots were suggested to the BBC and formatted using the BBC style…
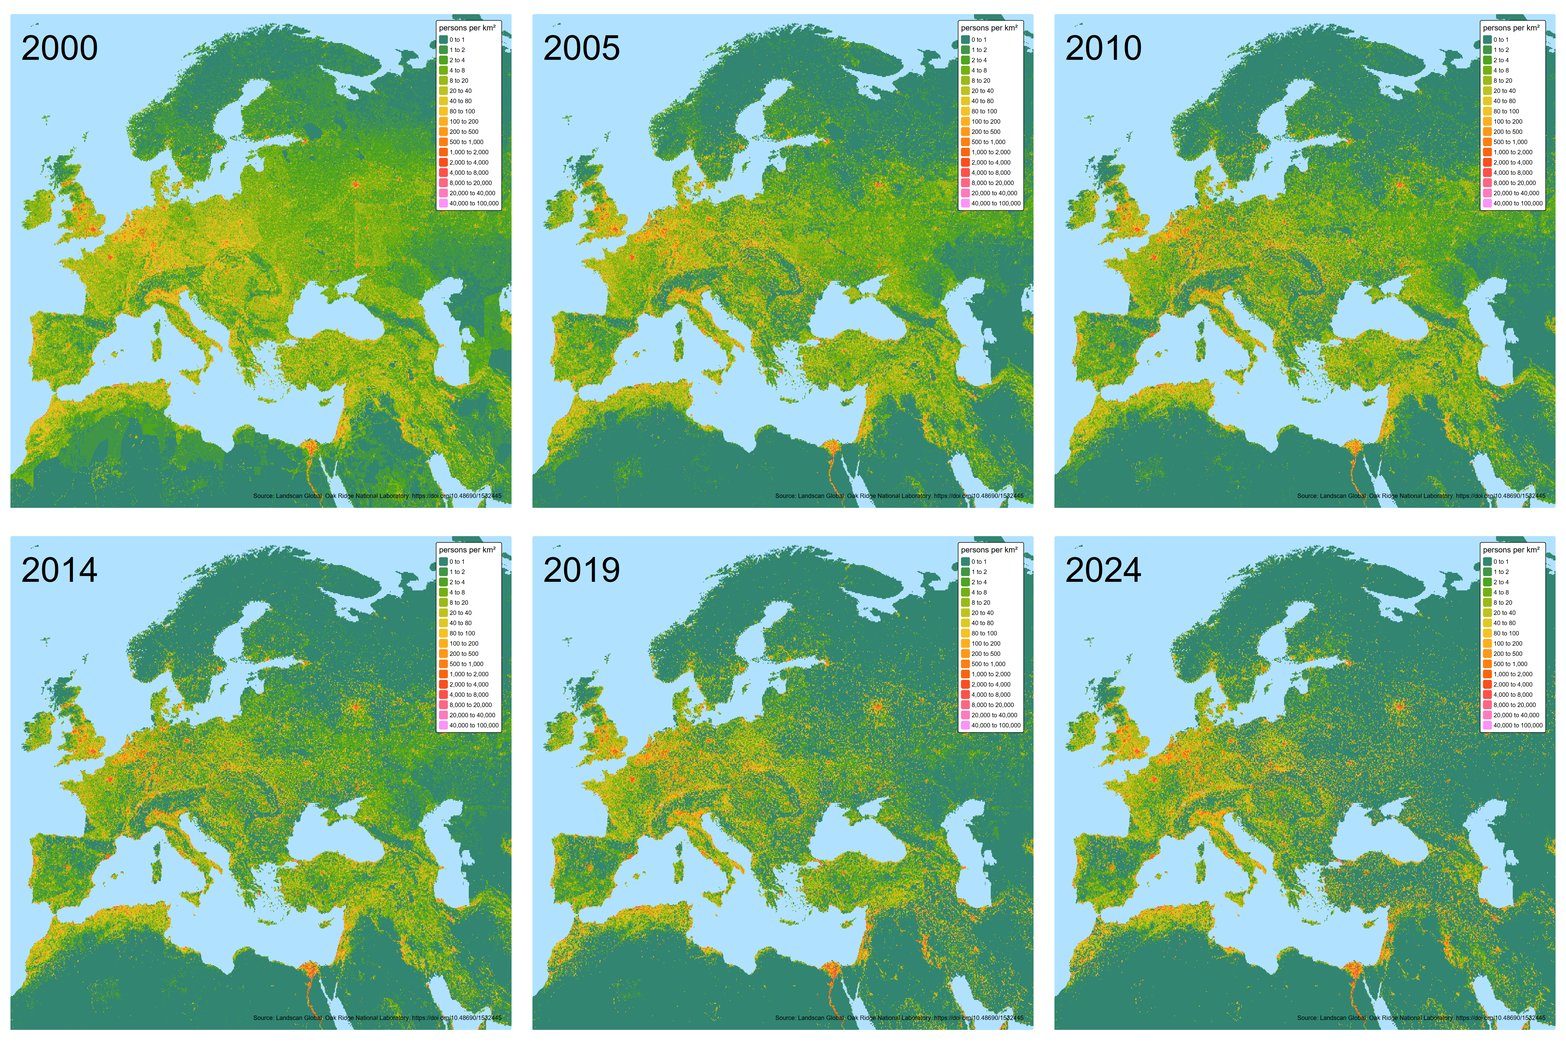
Showing ease of use of the Oak Ridge Landscan global 1km population raster with an animated plot of Europe over the years.
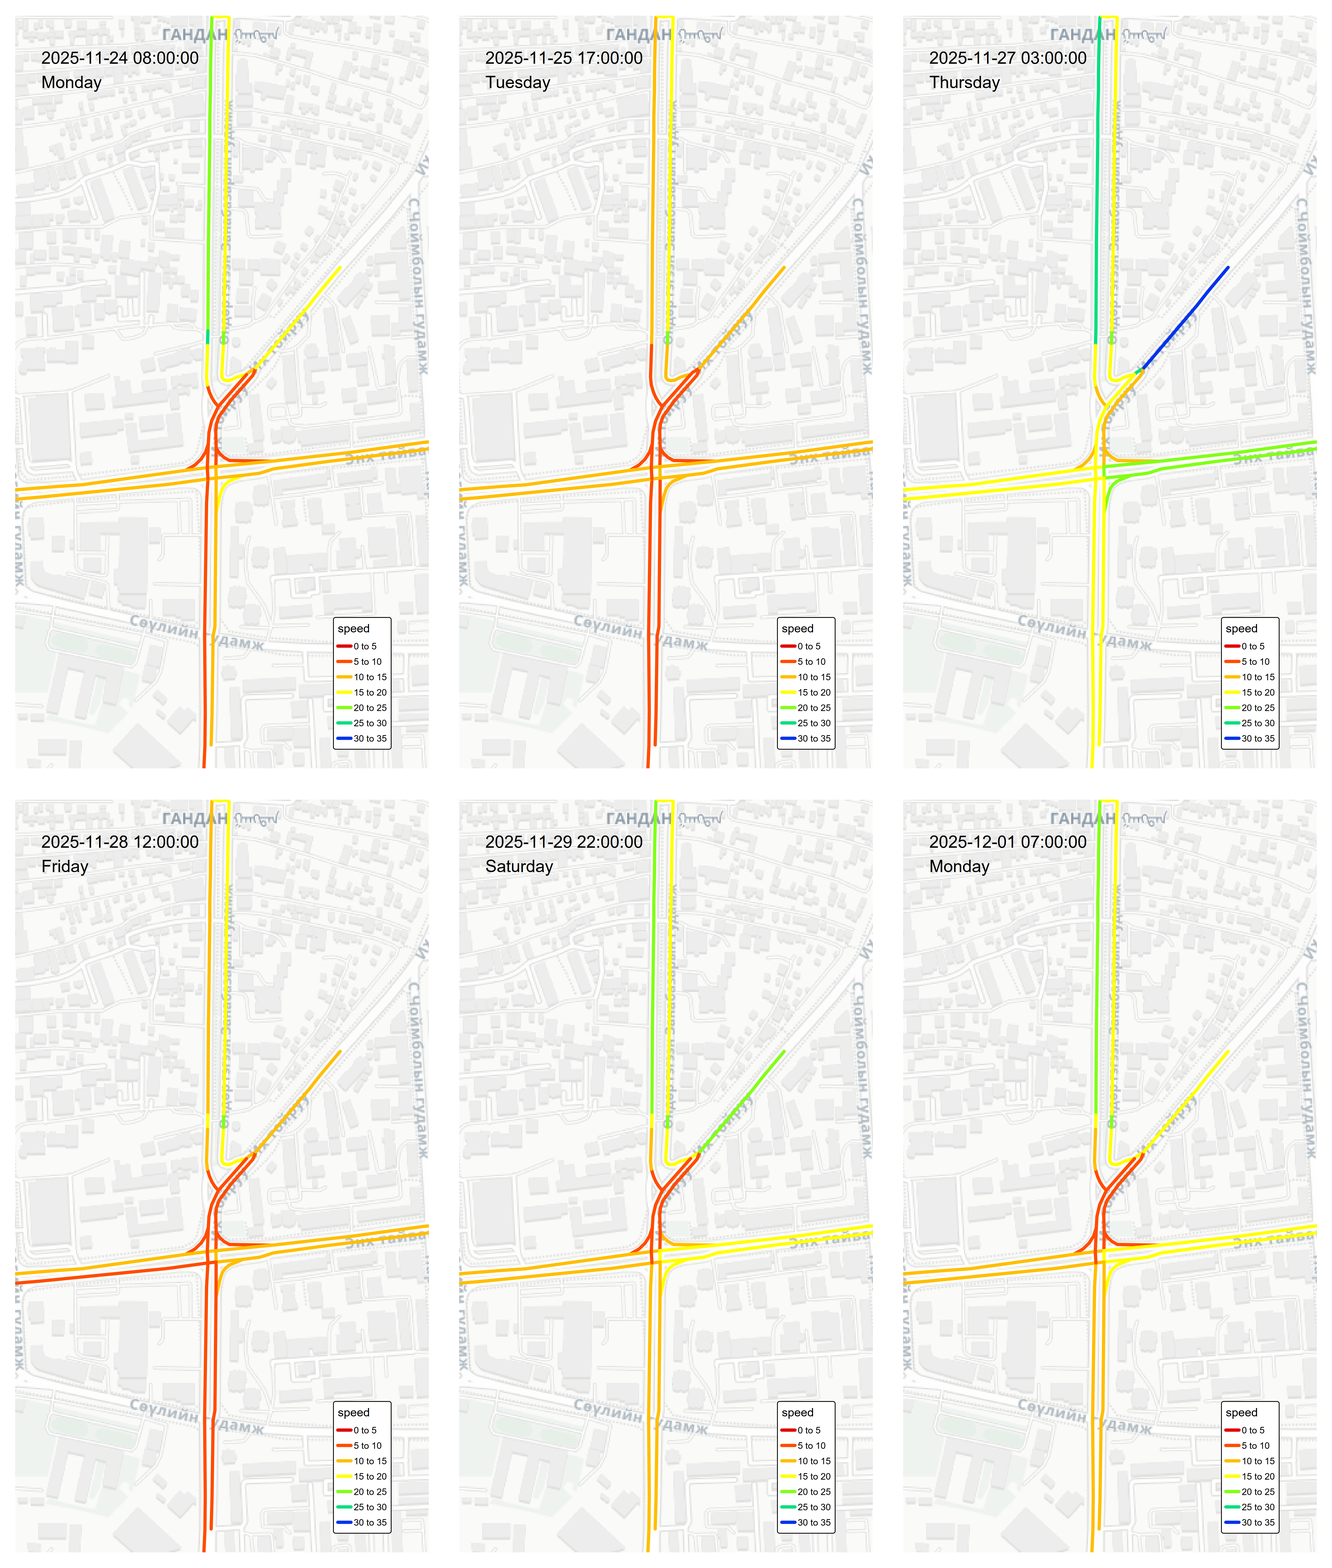
Function and demo showing how the Google Distance Matrix API can be used to get current speed profiles for any road in the world.
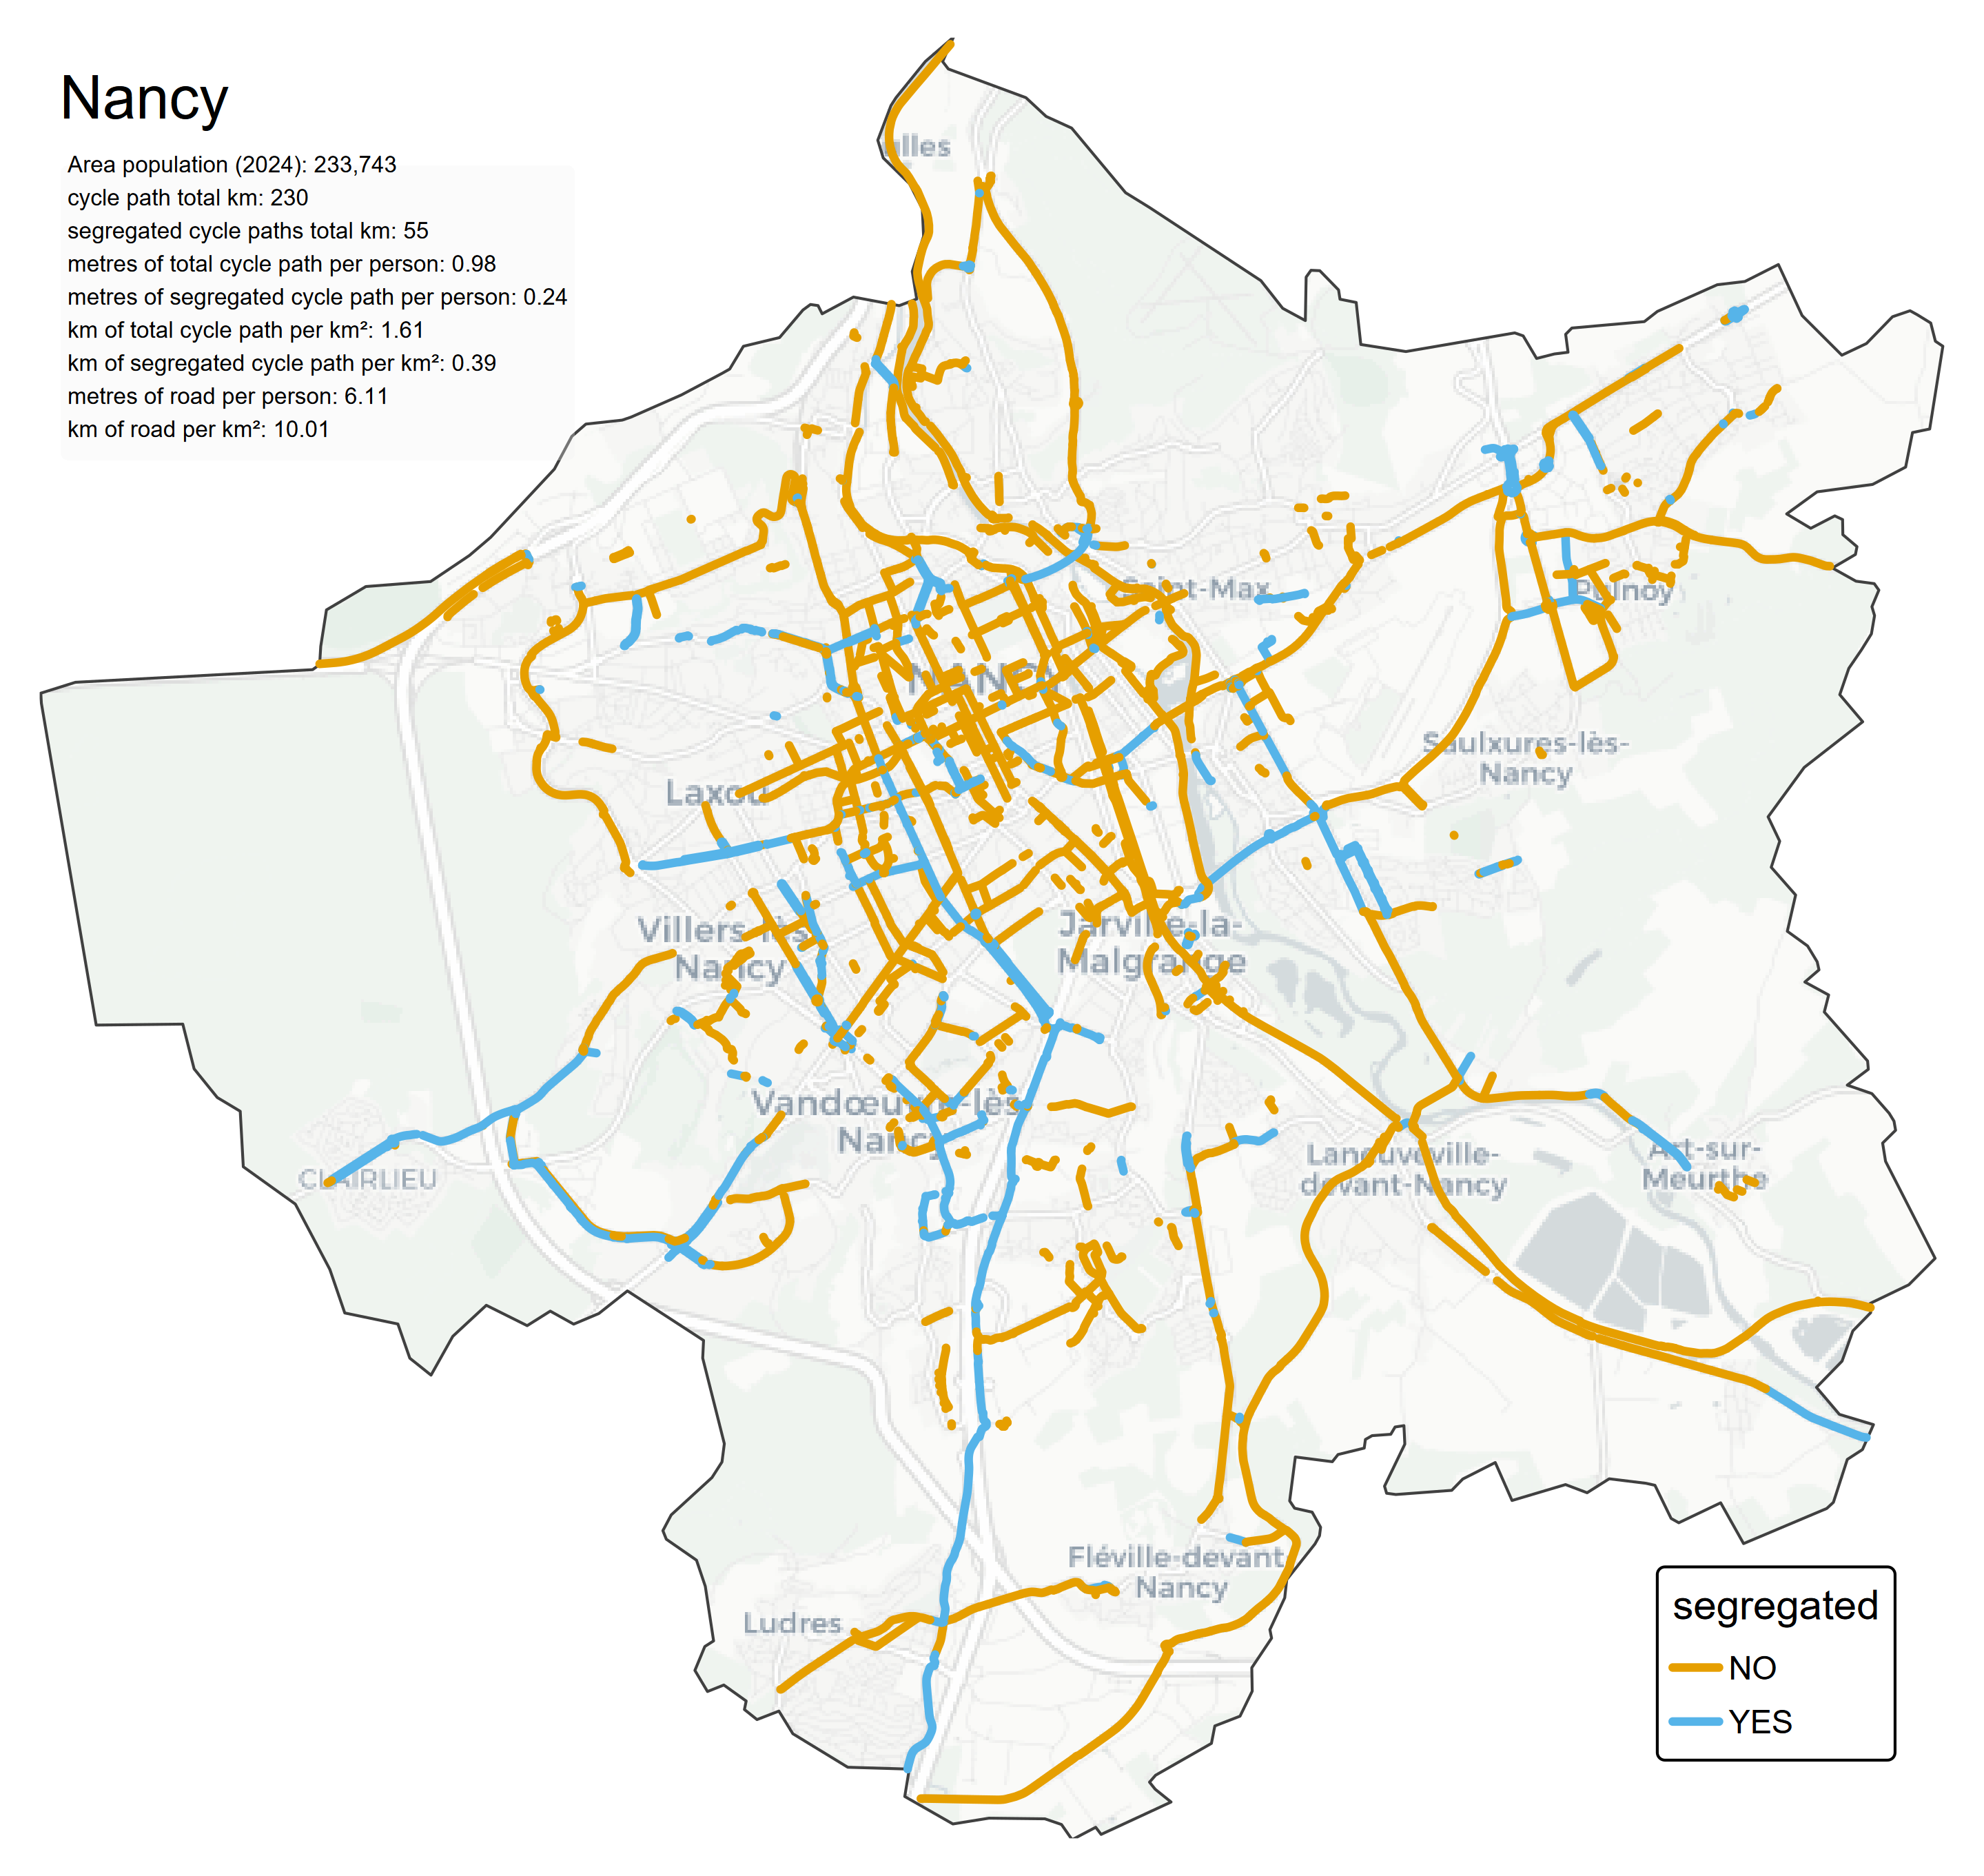
Applying the osmactive R package to cities around the world to determine the proportions of quality cycle infrastructure in each.
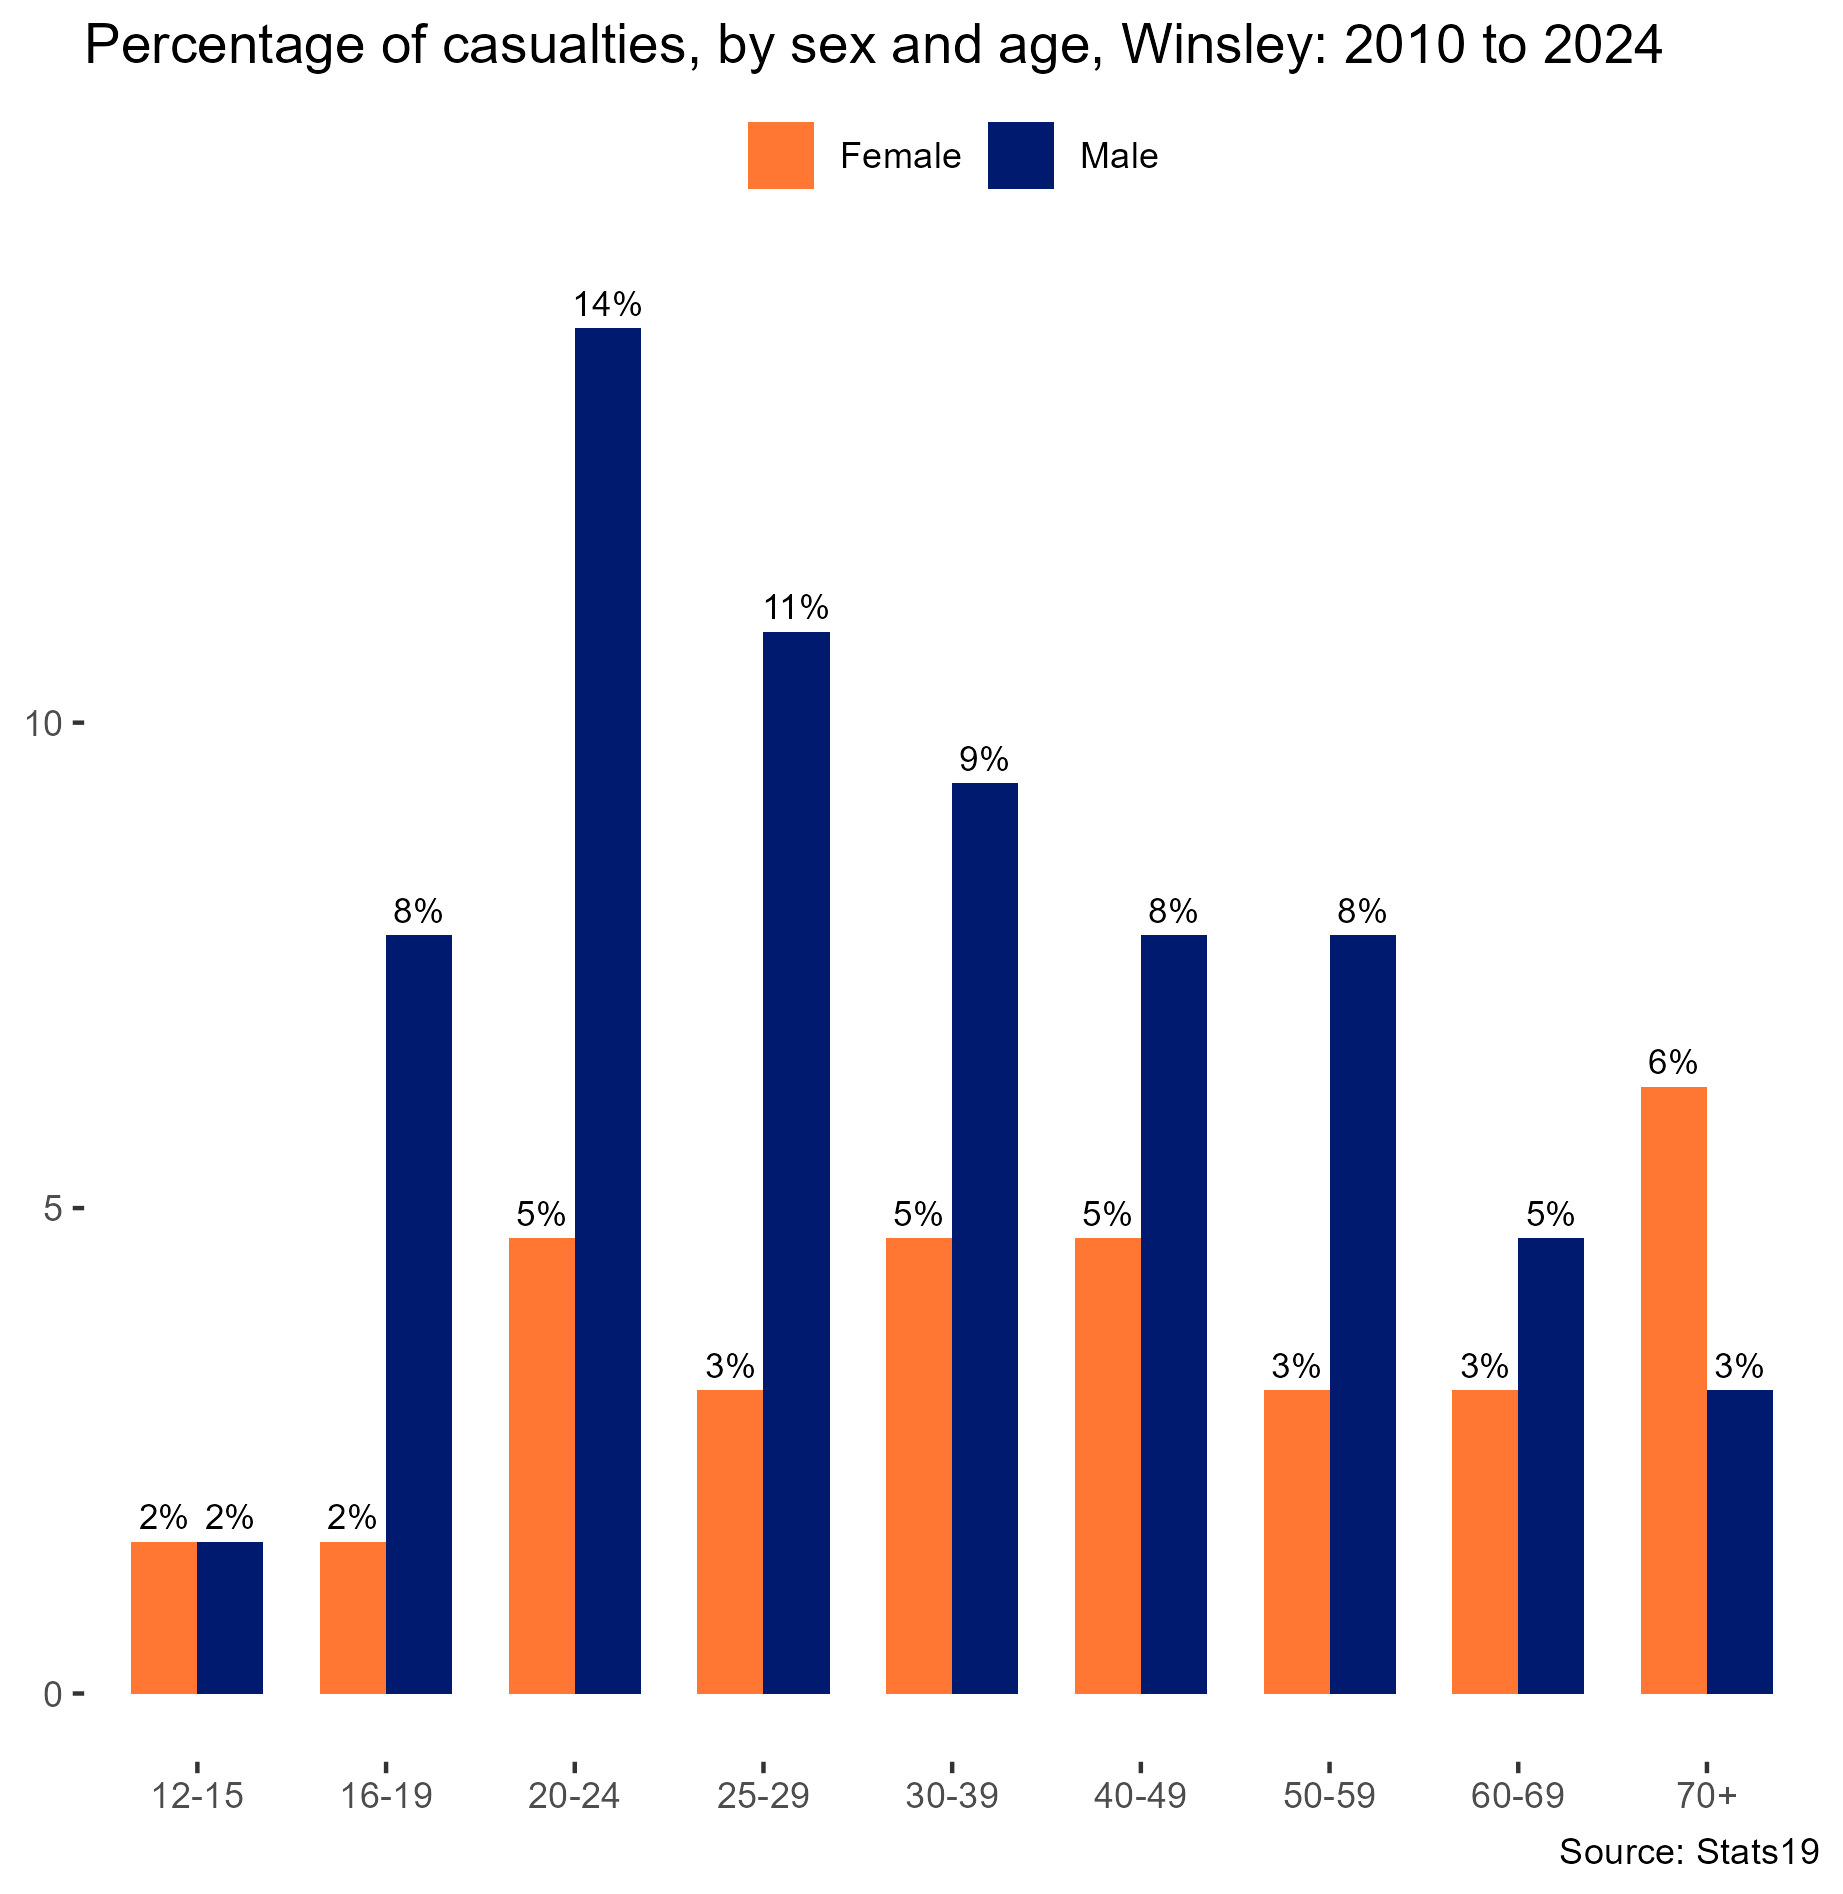
Breaking down the STATS19 data for the Parish of Winsley, Wiltshire.
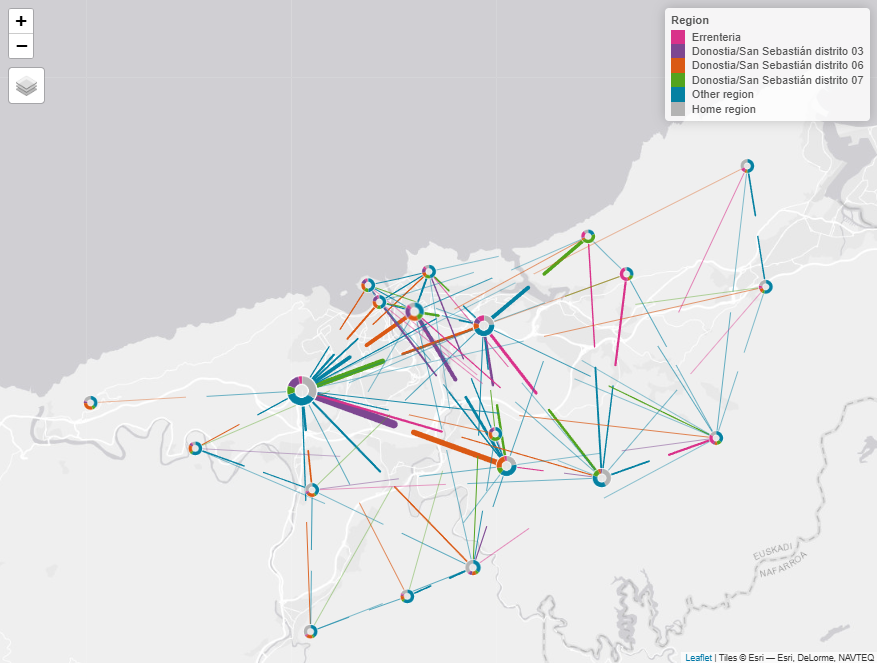
Plotting the open access Spanish Origin Destination (OD) using the TMAP R package donut plot.
A series of functions and scripts to generate reproducible reports from STATS19 data for local authorities with a focus on cyclist and pedestrian statistics.
Applying the OD Jitter R package to census data trips to generate a synthetic traffic dataset for Bath.
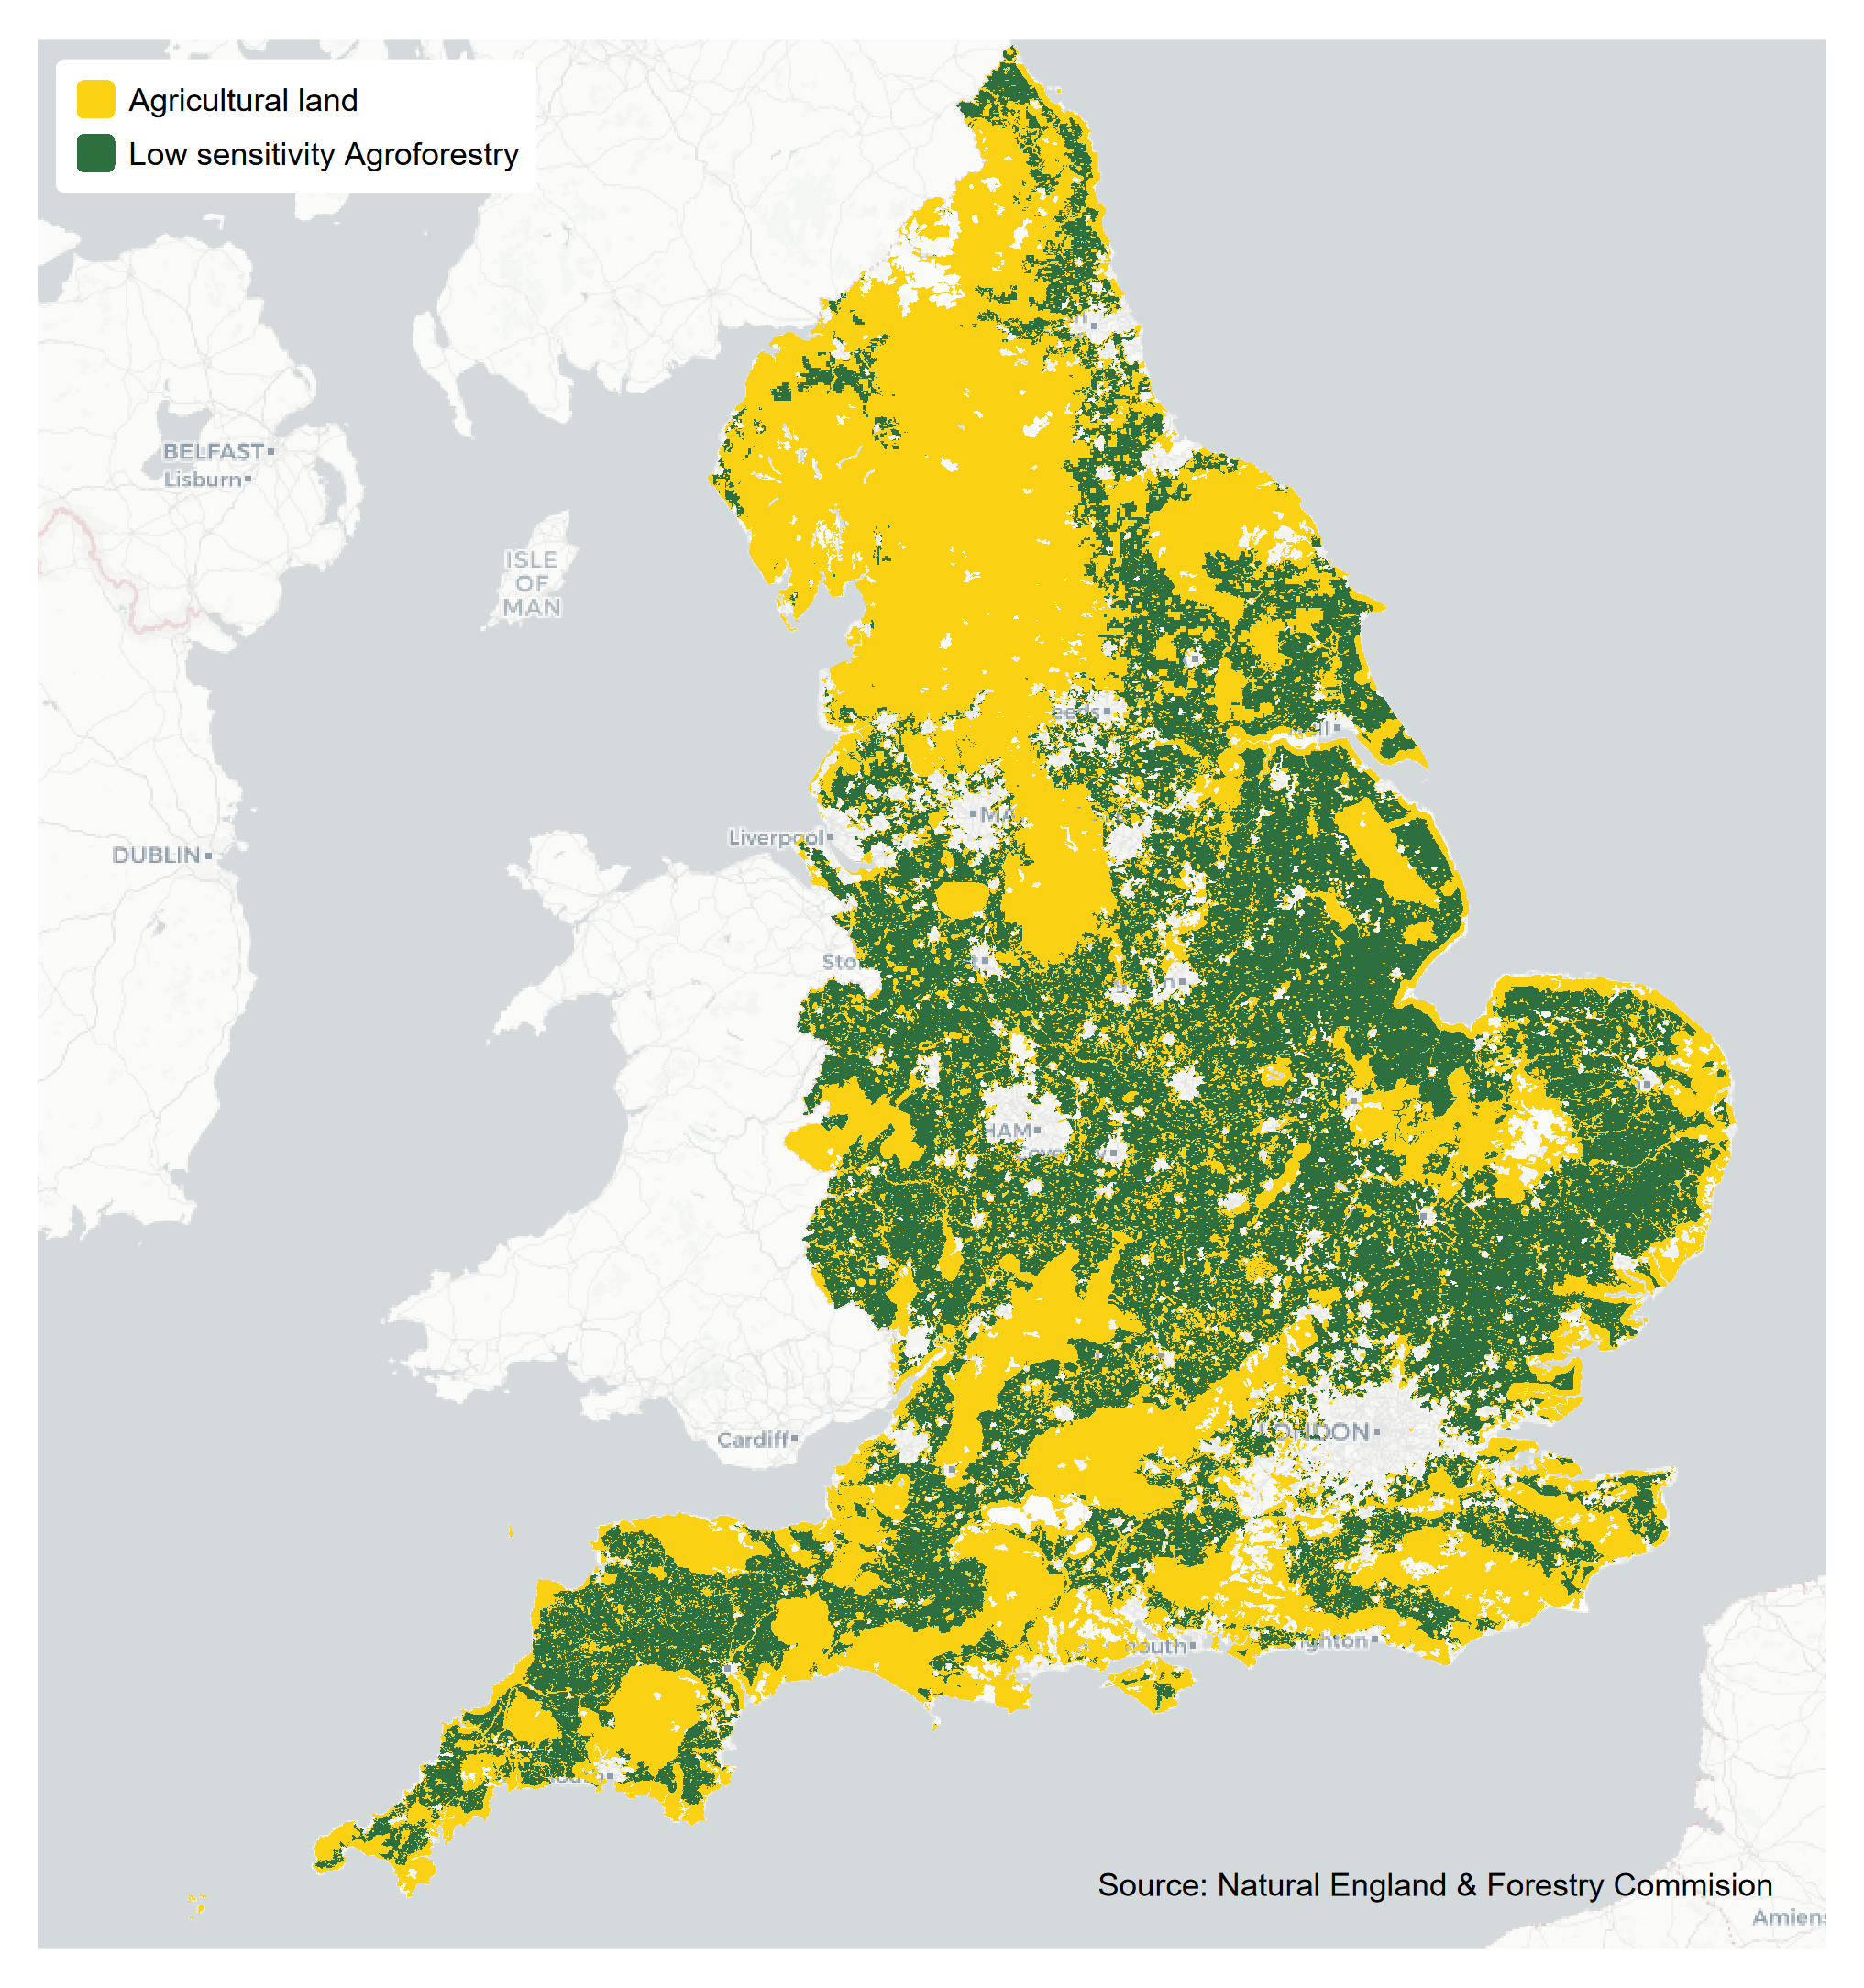
Reproducible plot of UK agroforestry potential for article on Agroforestry for the Environmental Scientist Magazine.
Reproducible example to demonstrate how R could be used for geoaccounting for a client.
geoaccounting
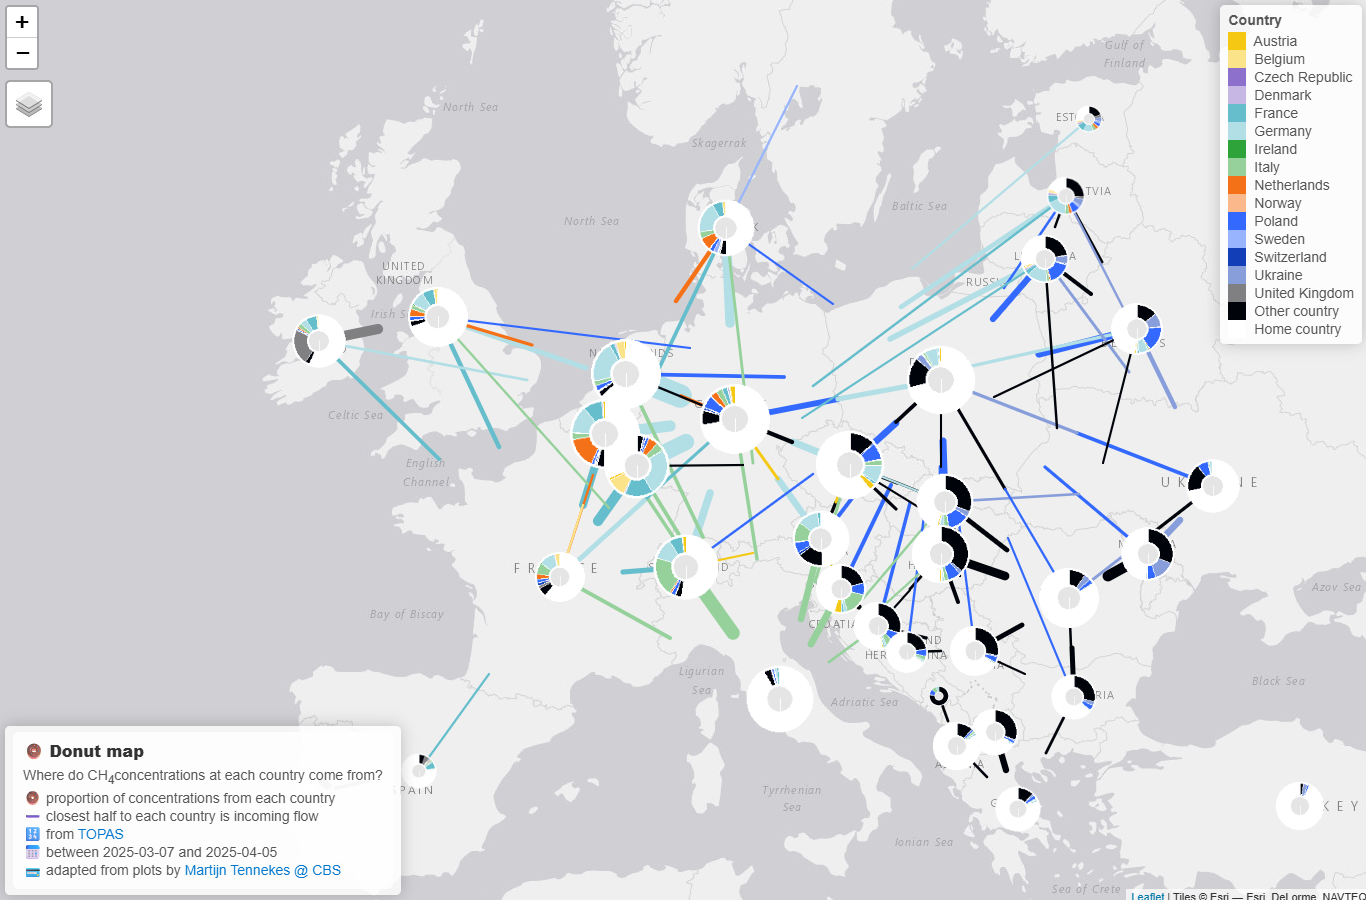
Adapting the donut maps script from Martijn Tennekes to show country labelled air pollution (i.e. where air pollution originates and ends up), code…
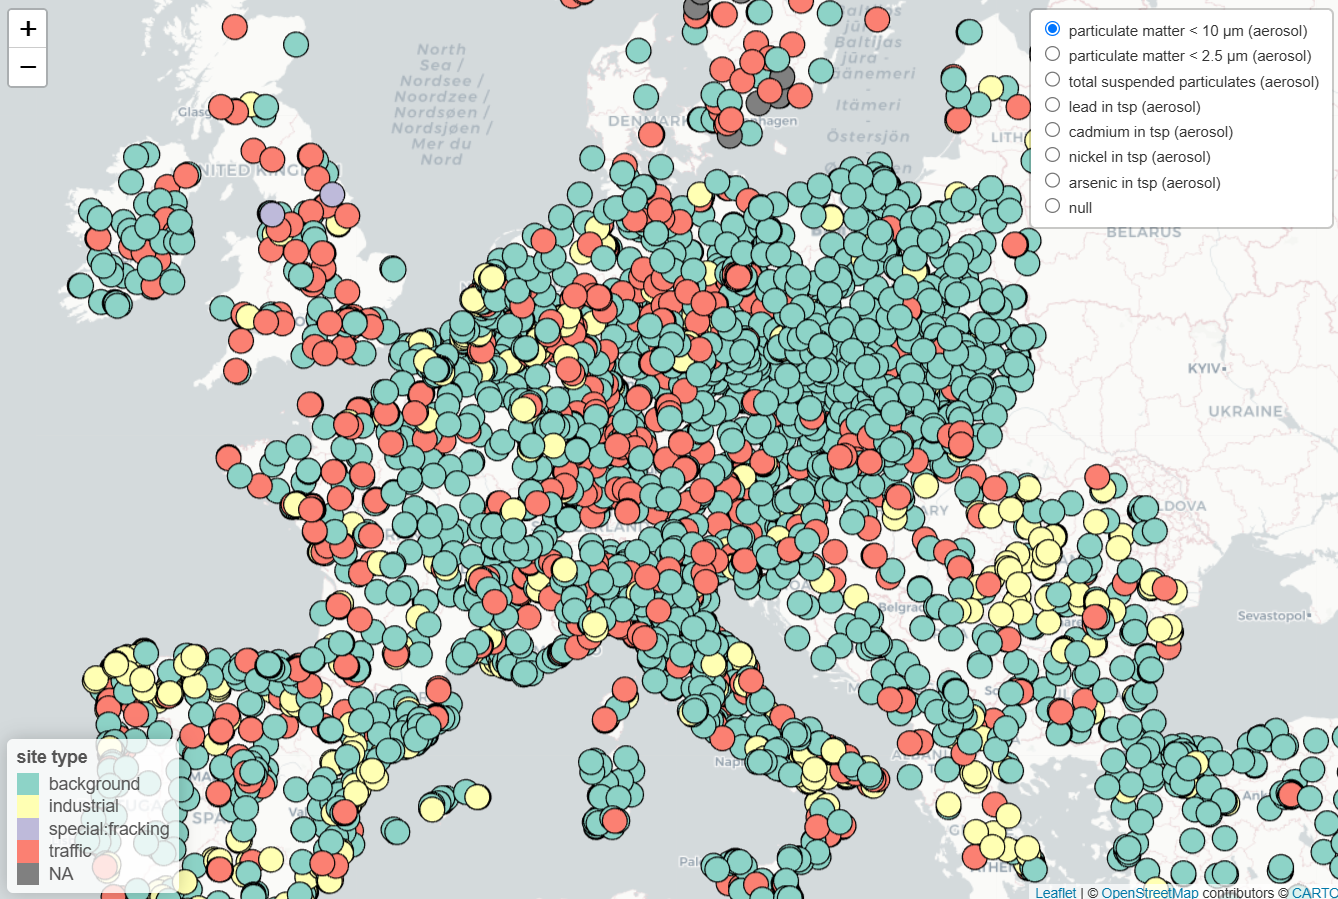
Short reproducible script to generate interactive plot of European Air Quality sites as organised by the saqgetr R package.
Analysis and plotting of the ECMWF meteo data for trip I took on the Tres Hombres Cargo ship with Fair Transport in summer 2025.
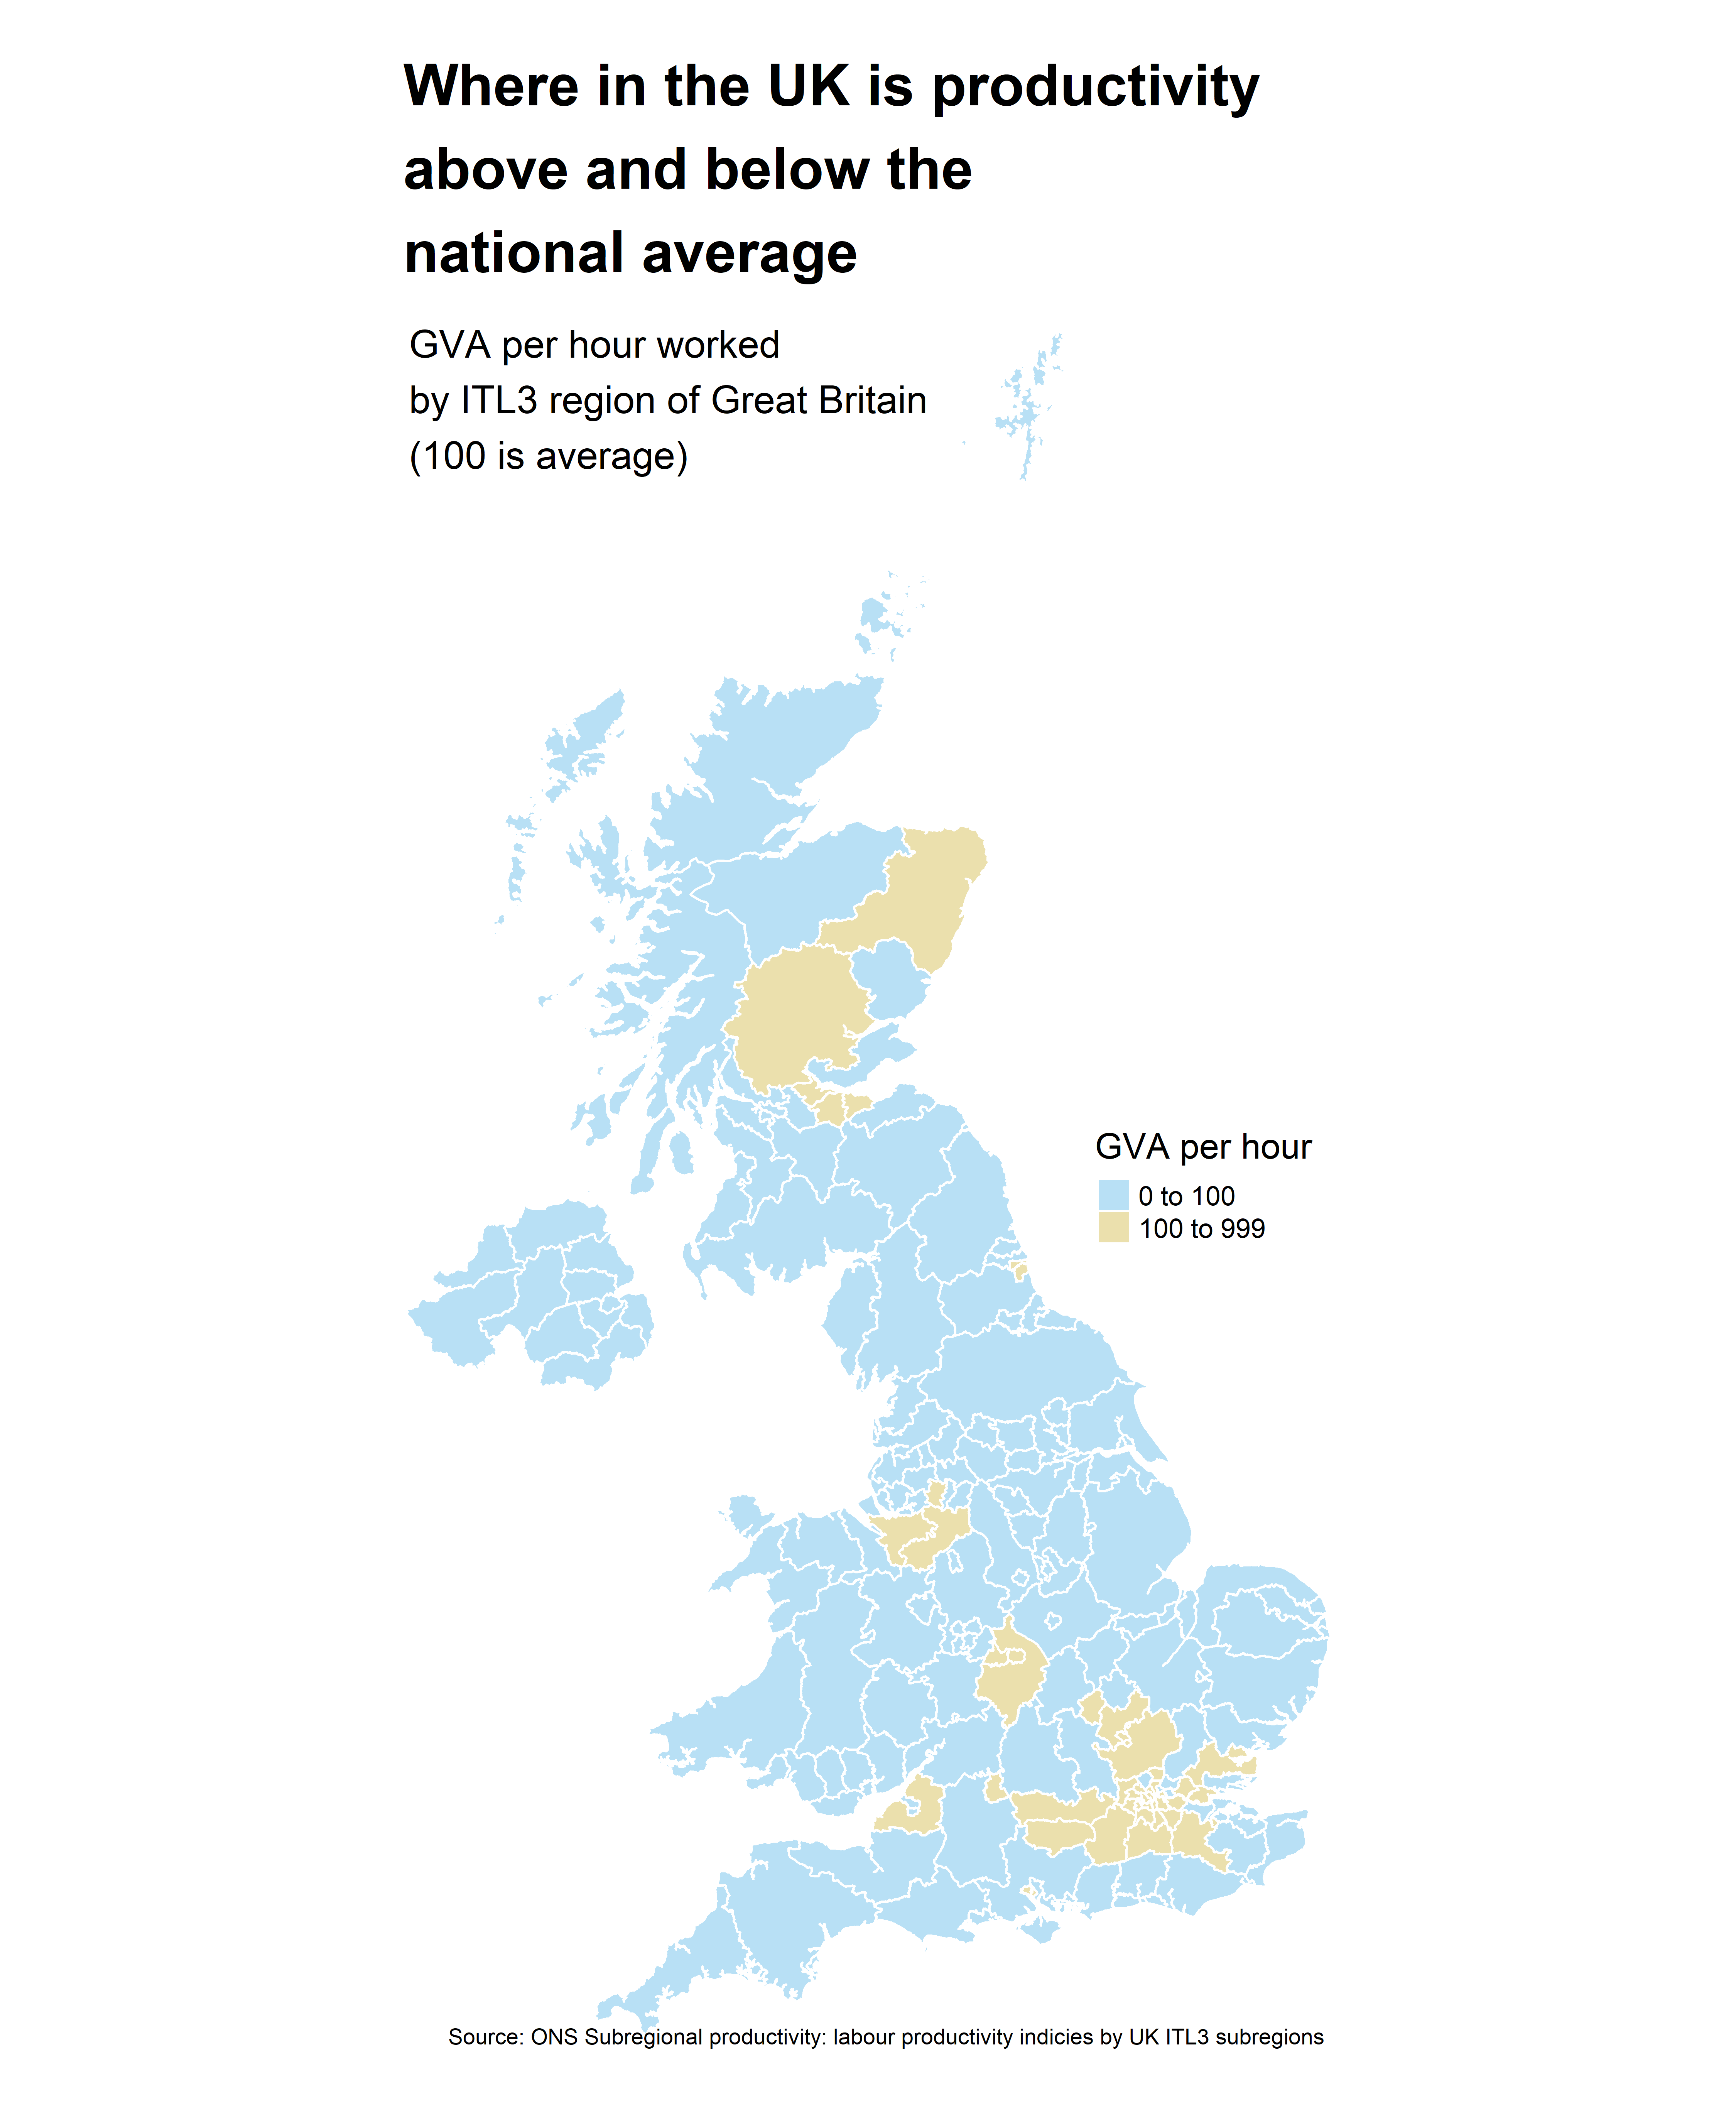
Reproducible plot of ONS productivity data.
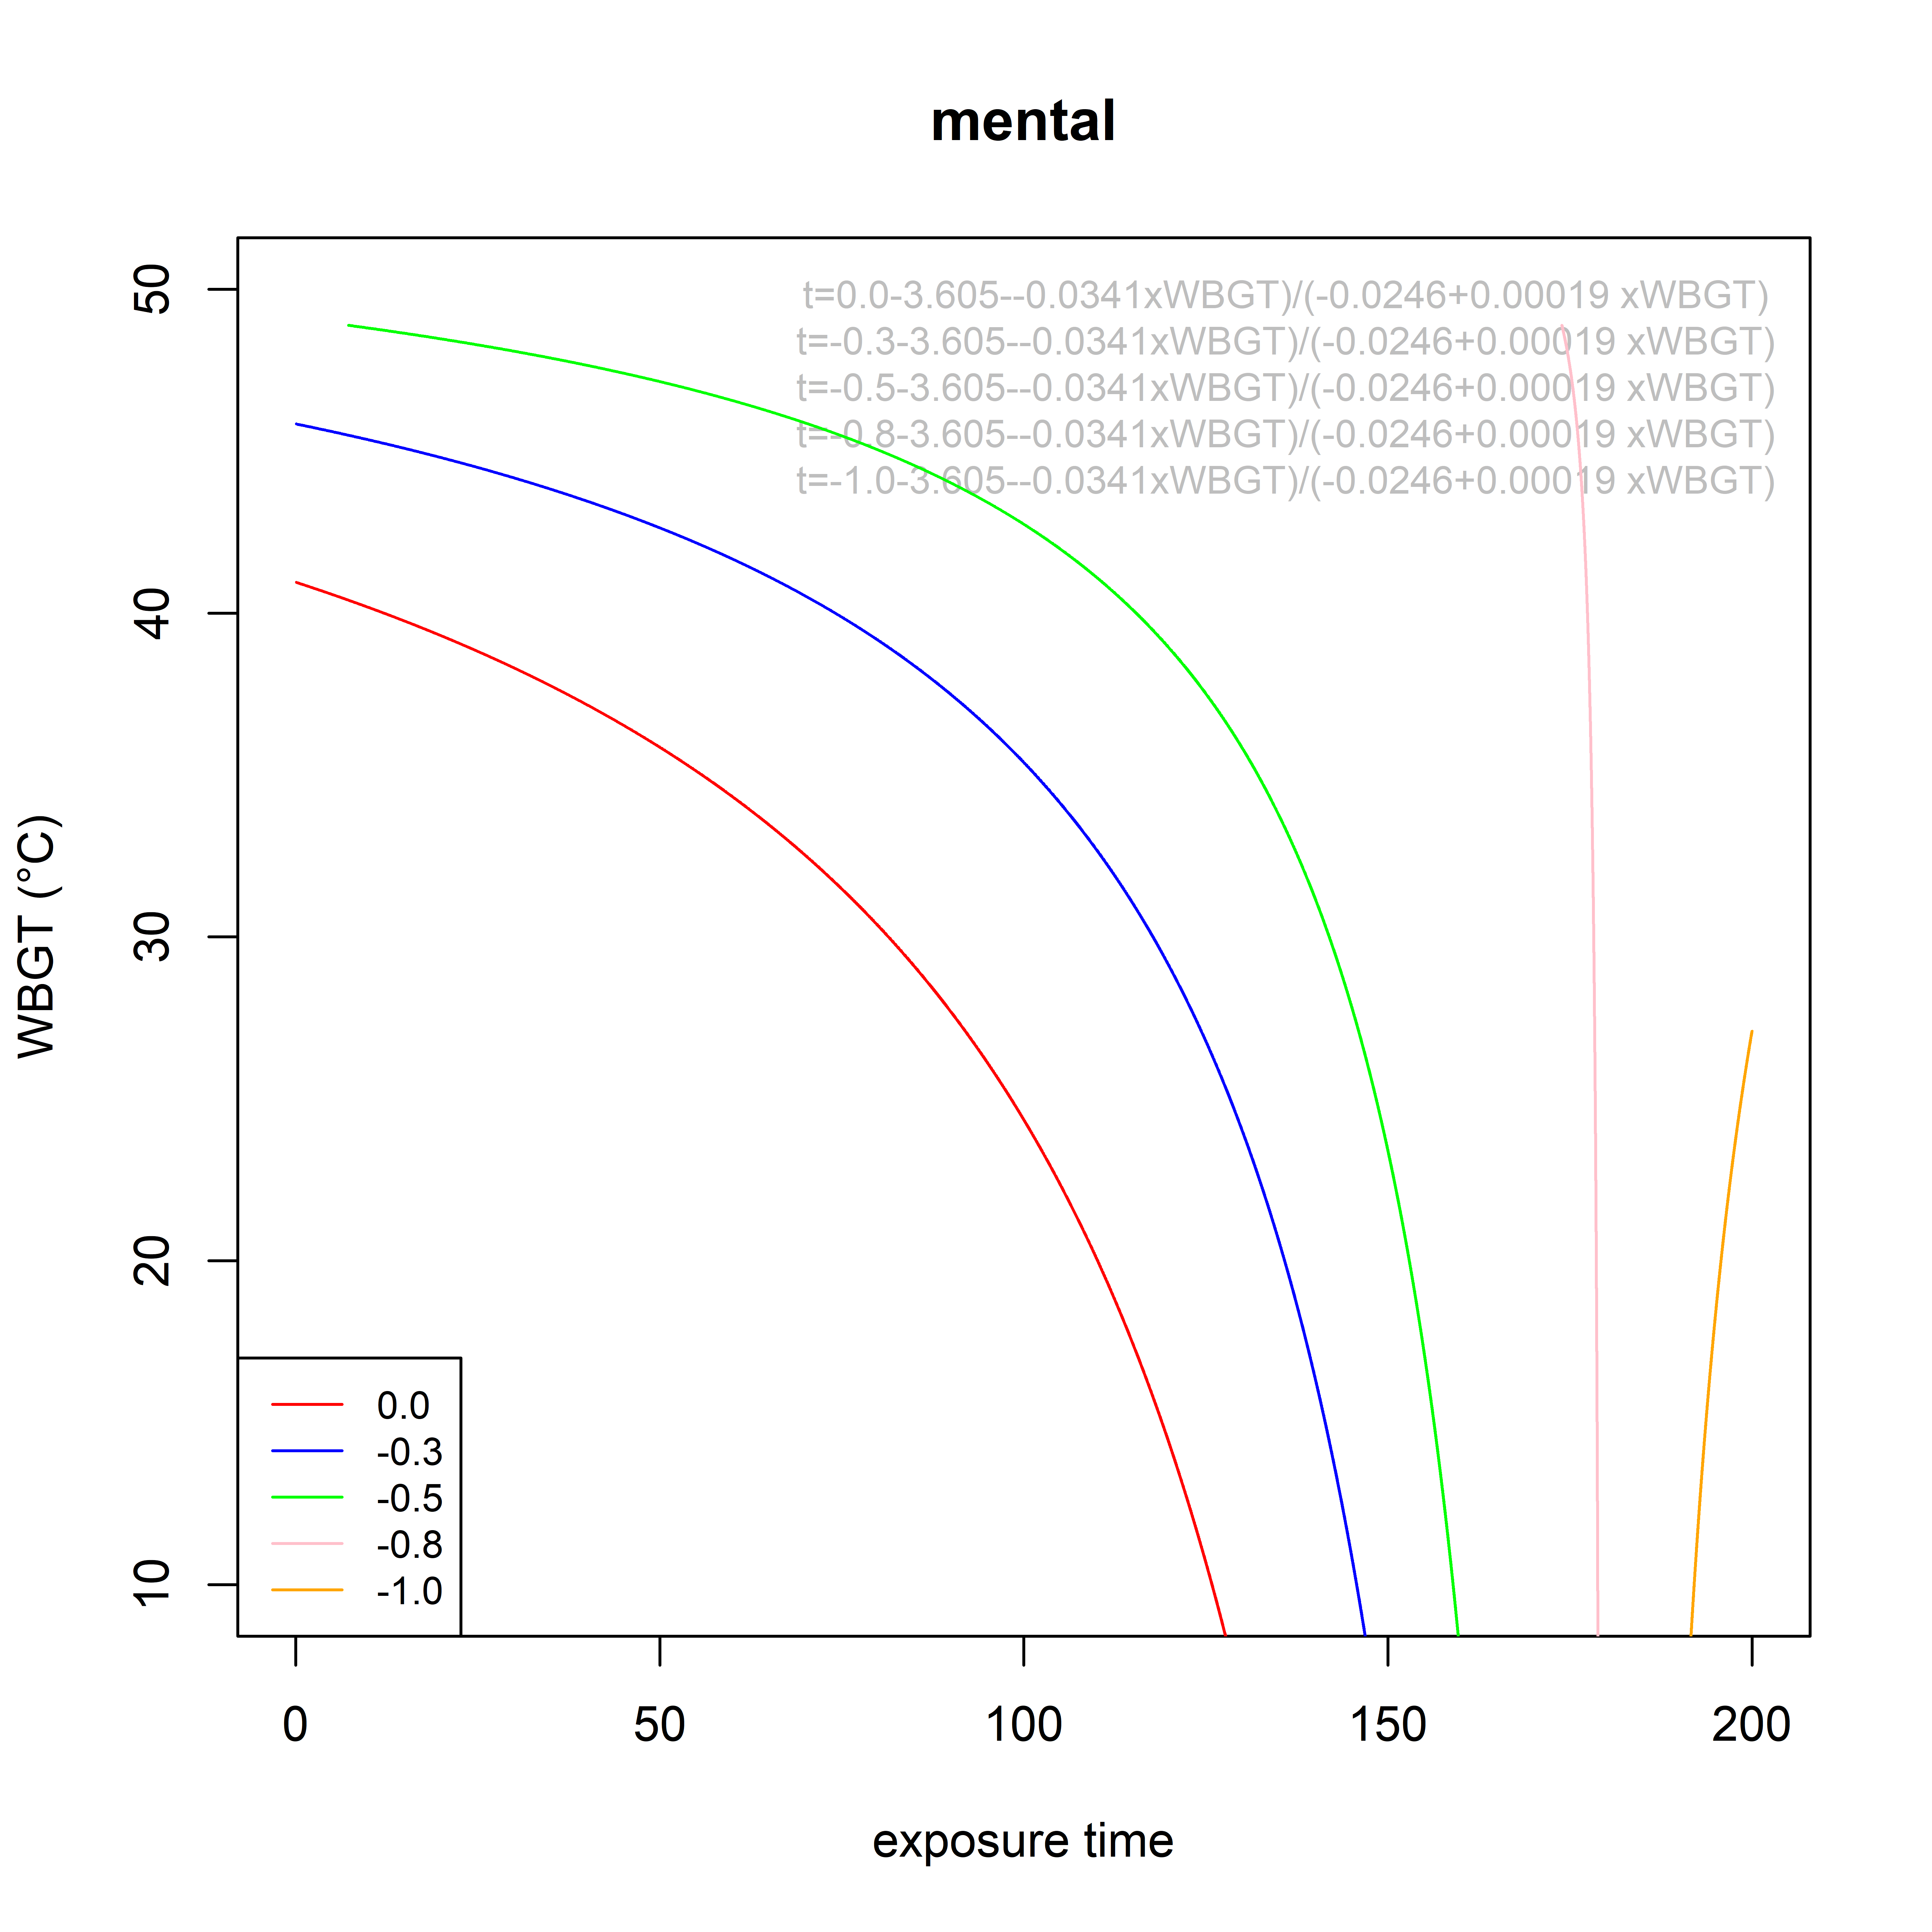
Equations defined and plotted from the Hancock & Vasmatzidis update of the hand-drawn Isodecrement human performance curves at various WBGT (°C).
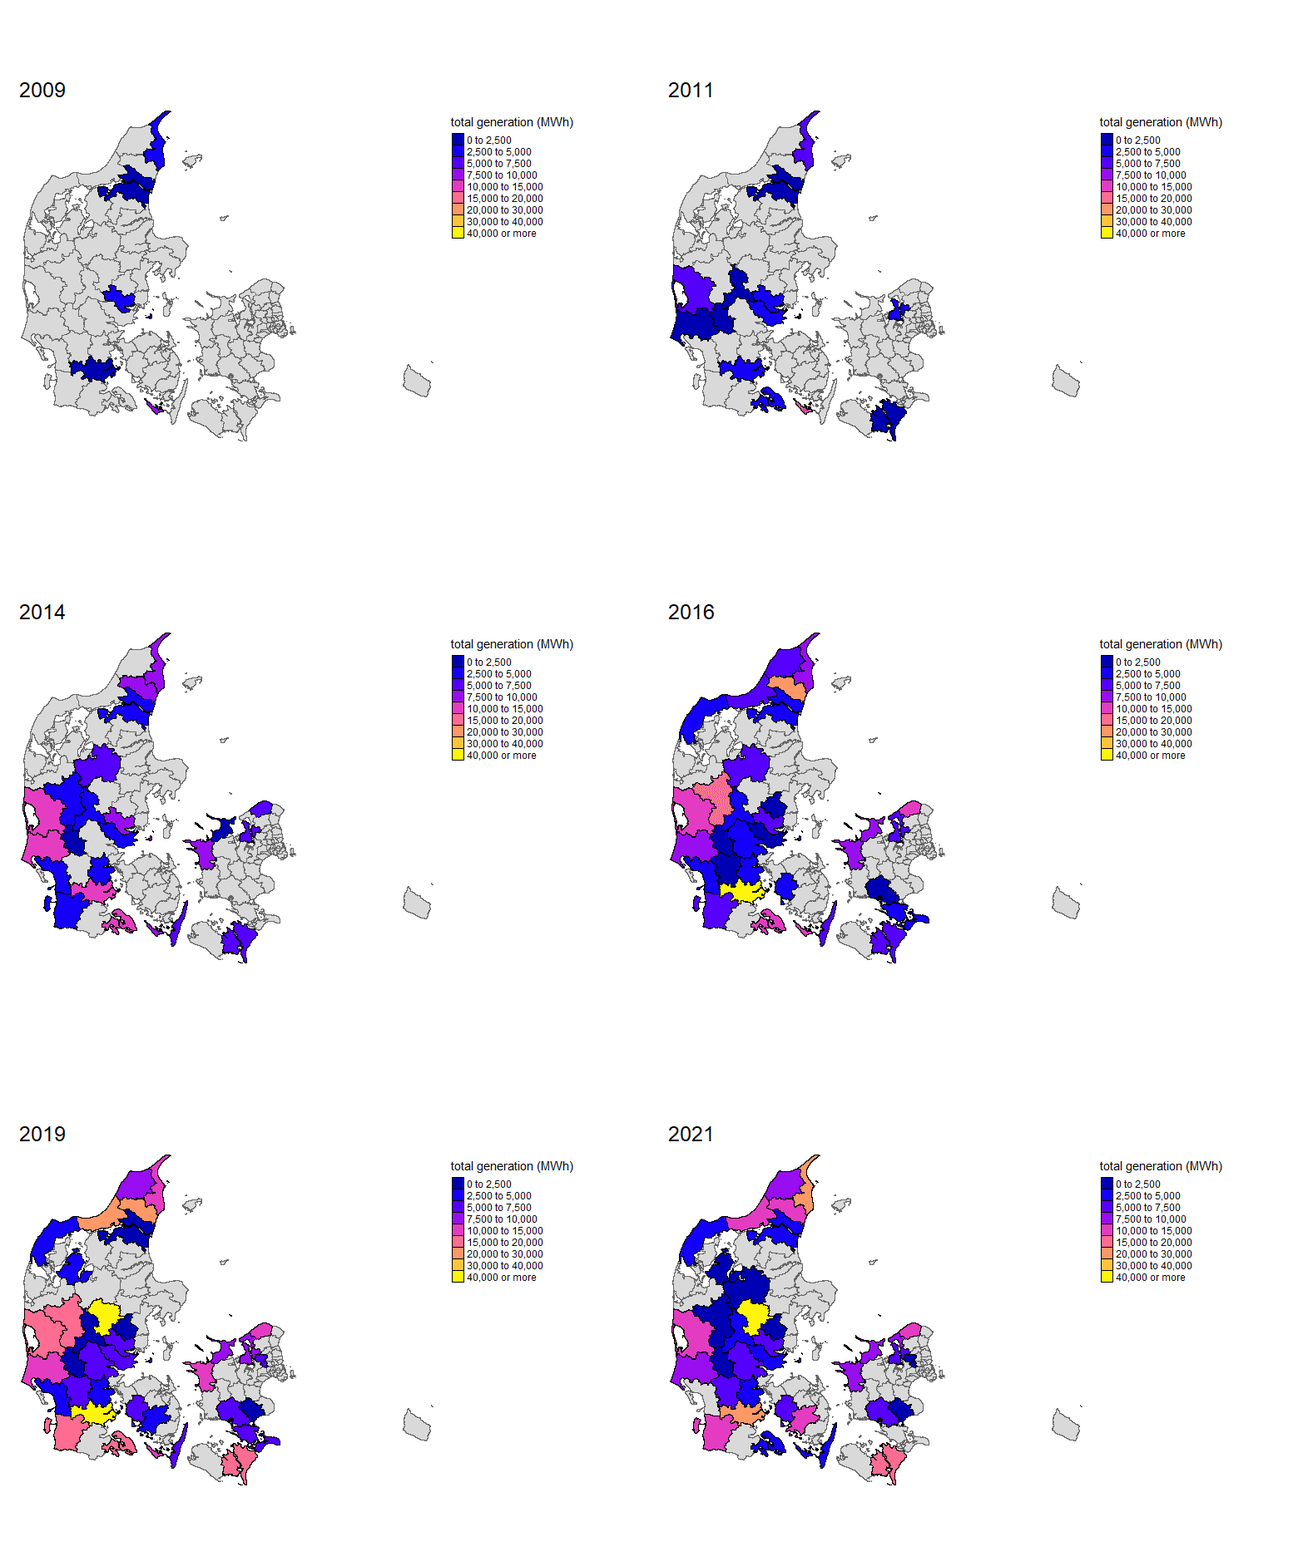
After a visit to Vrå I built a script to scrape Danish district heating solar thermal sites from main website and plotting on an interactive map and gif showing progress of…
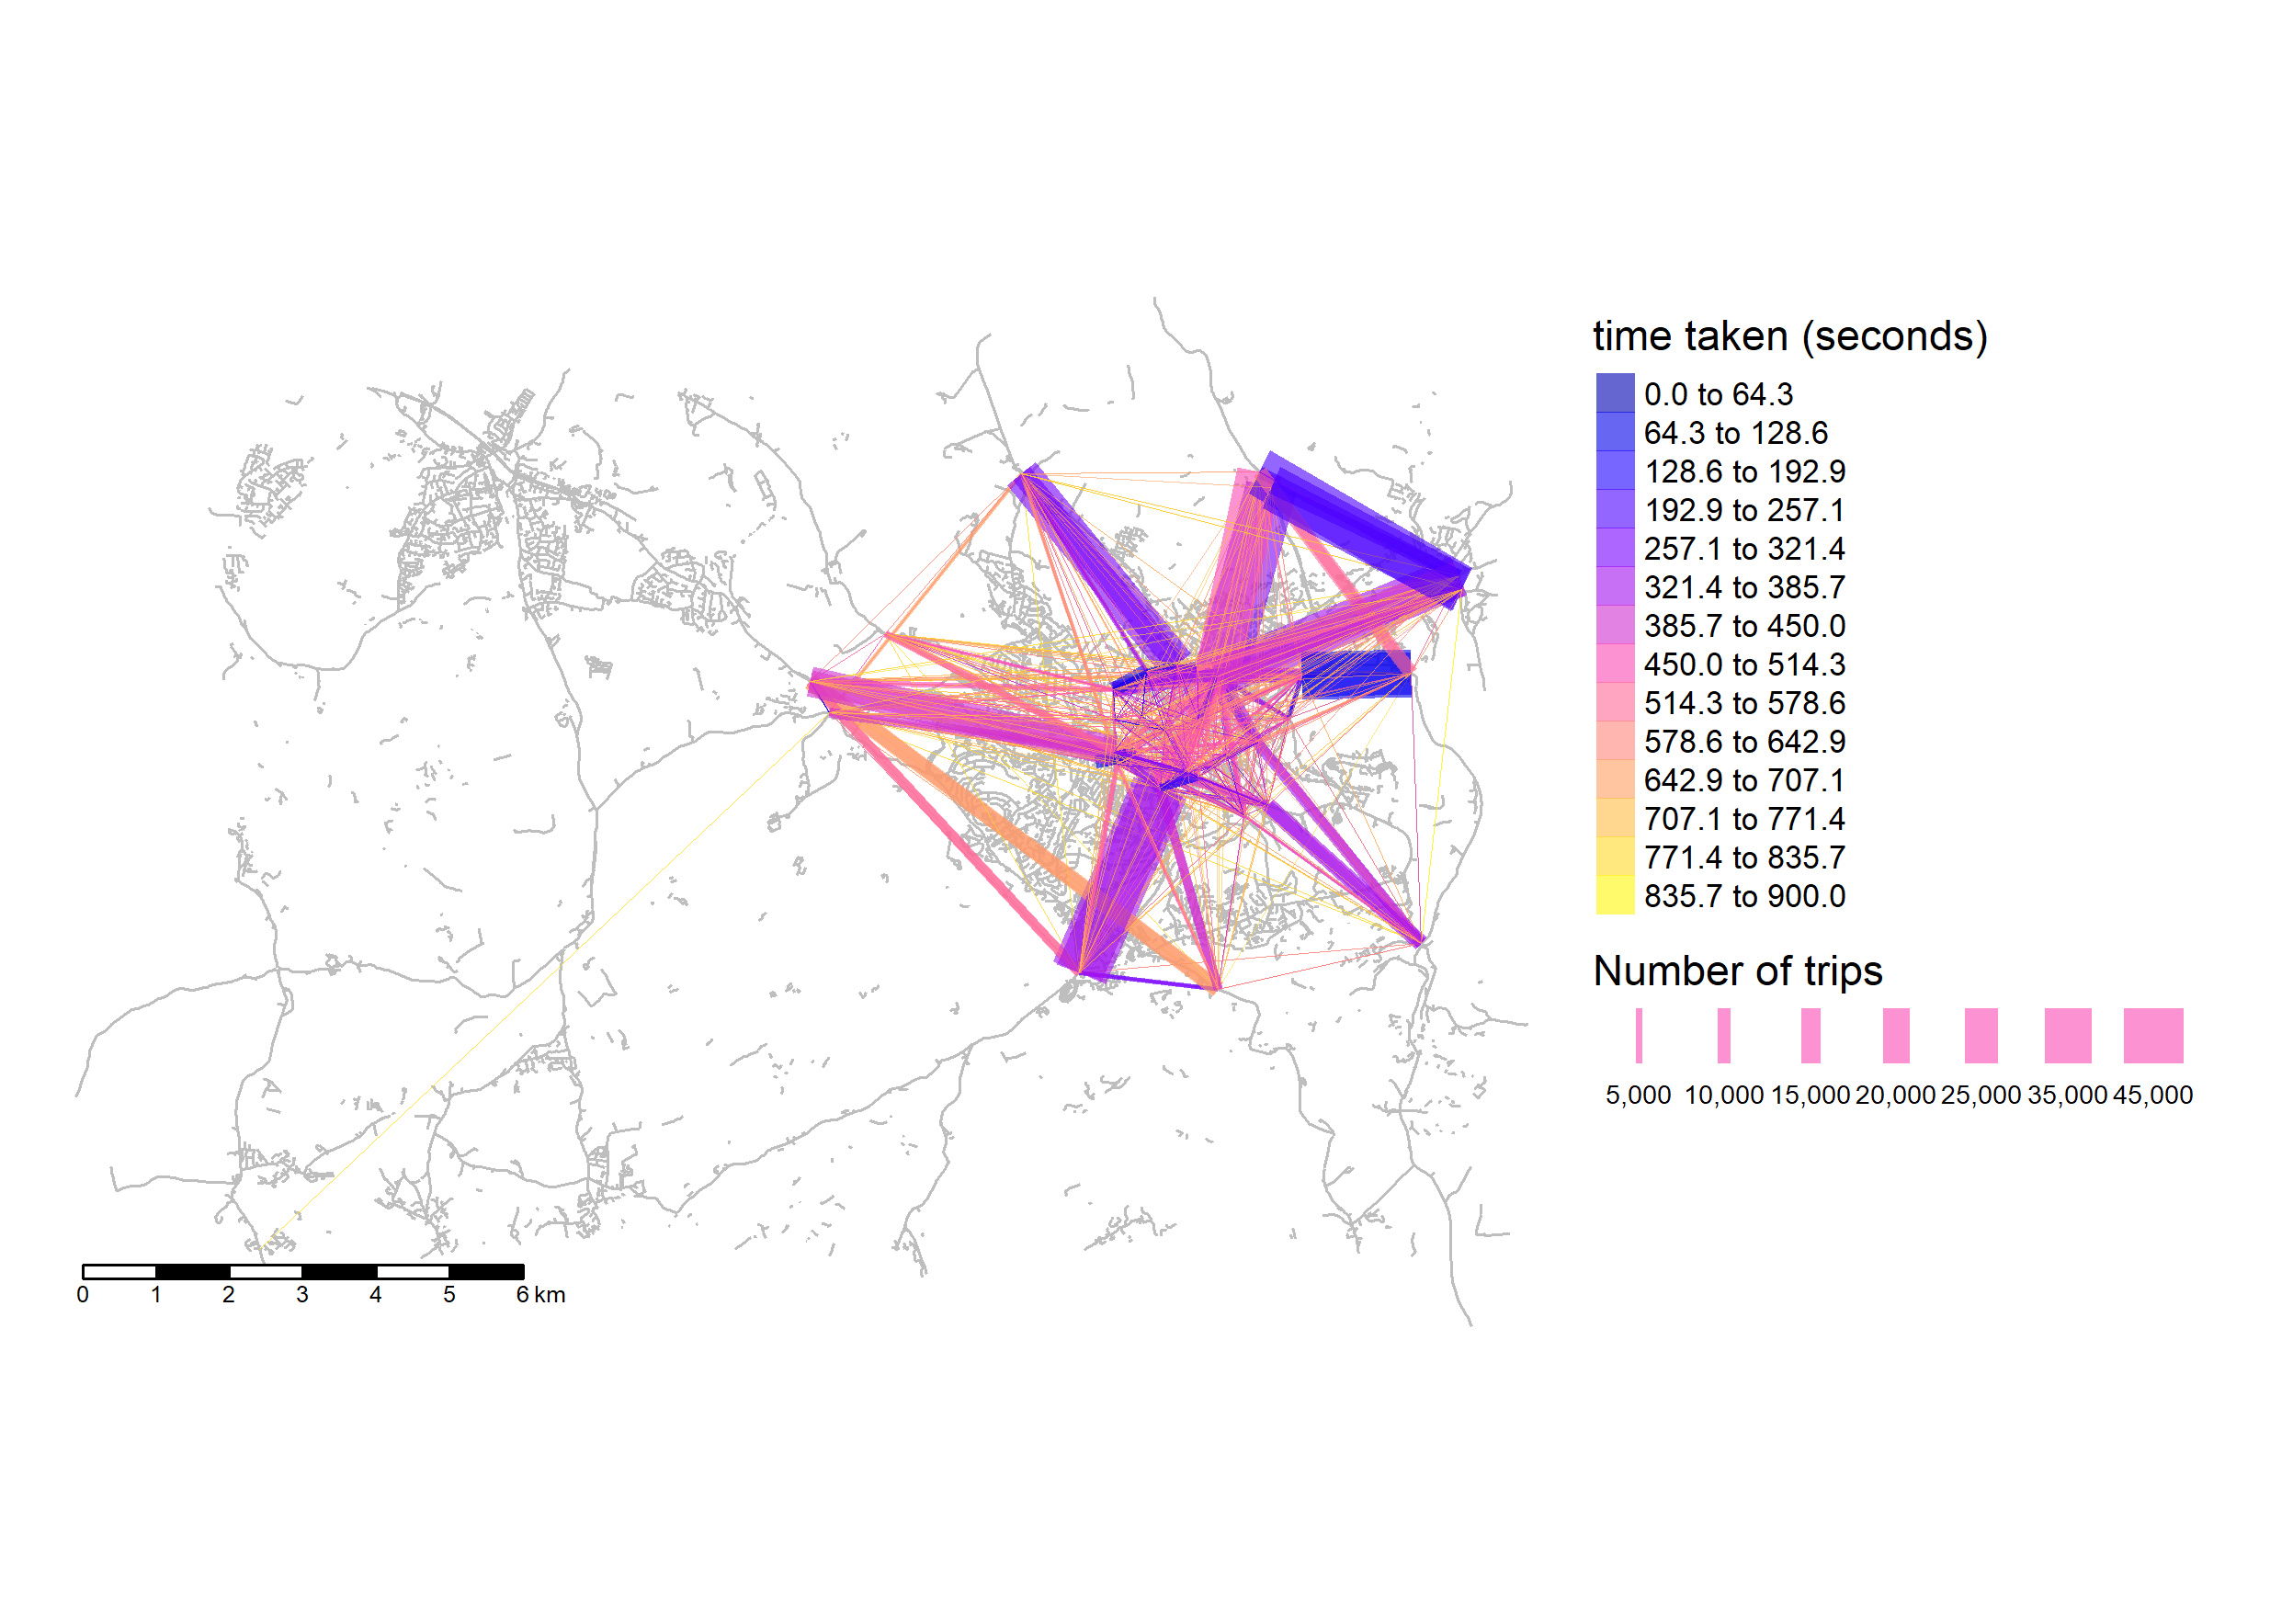
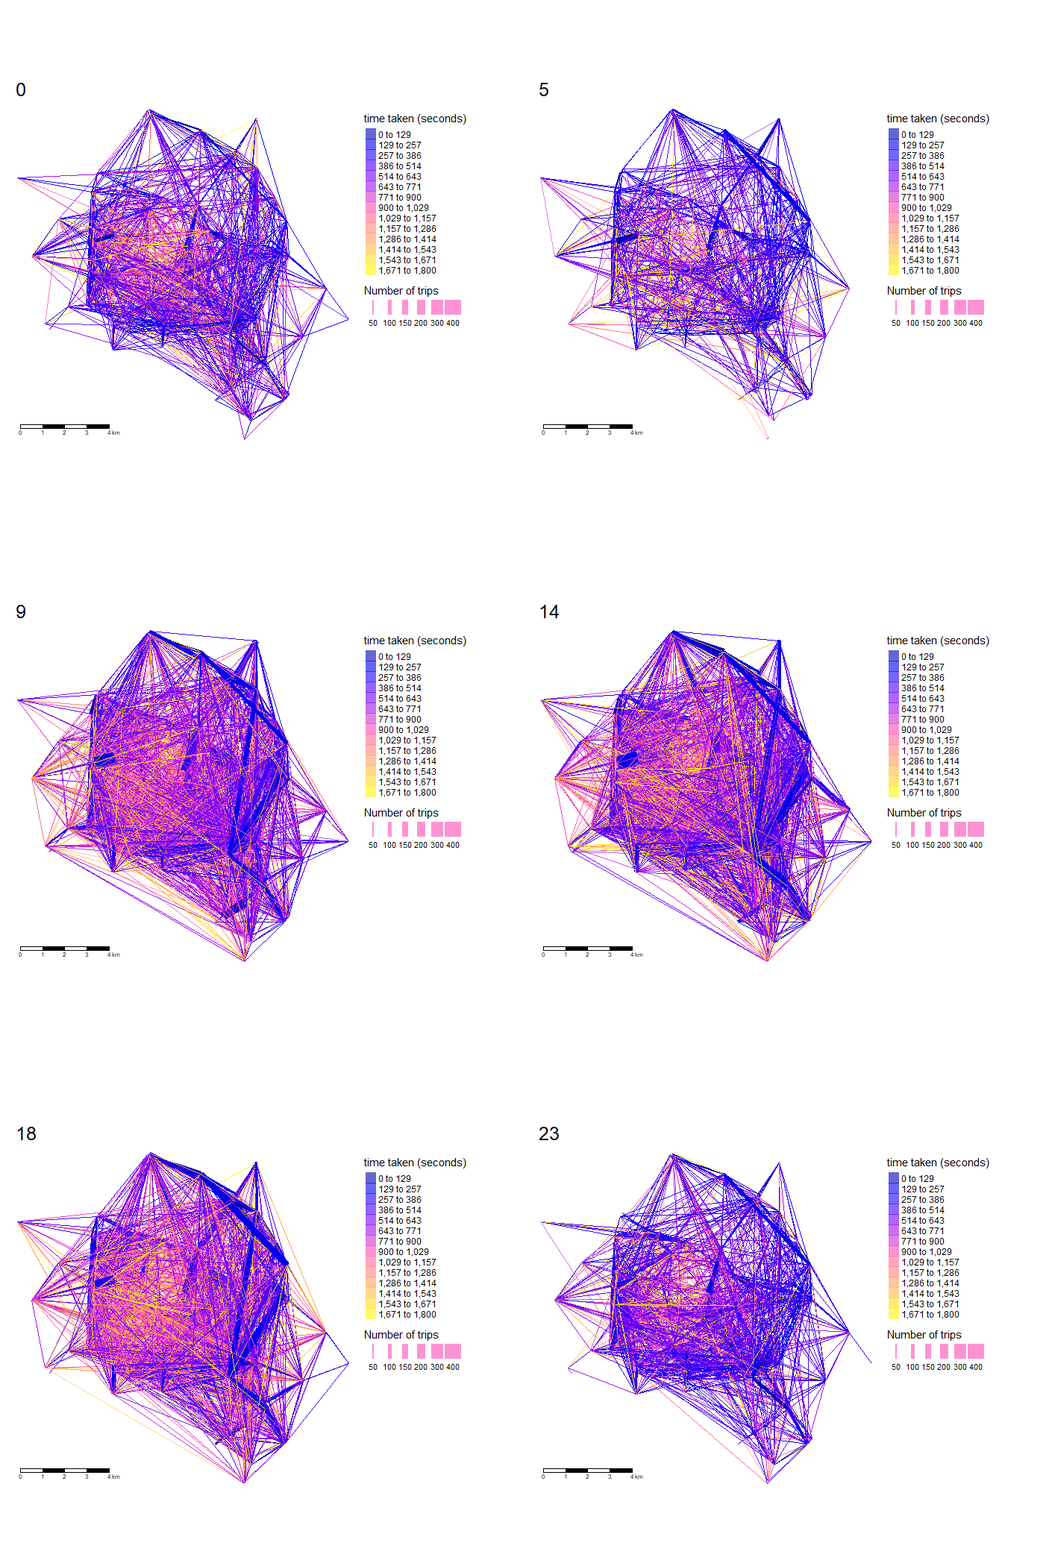
Example of how a small sample of ANPR data can be used to generate estimates for trips
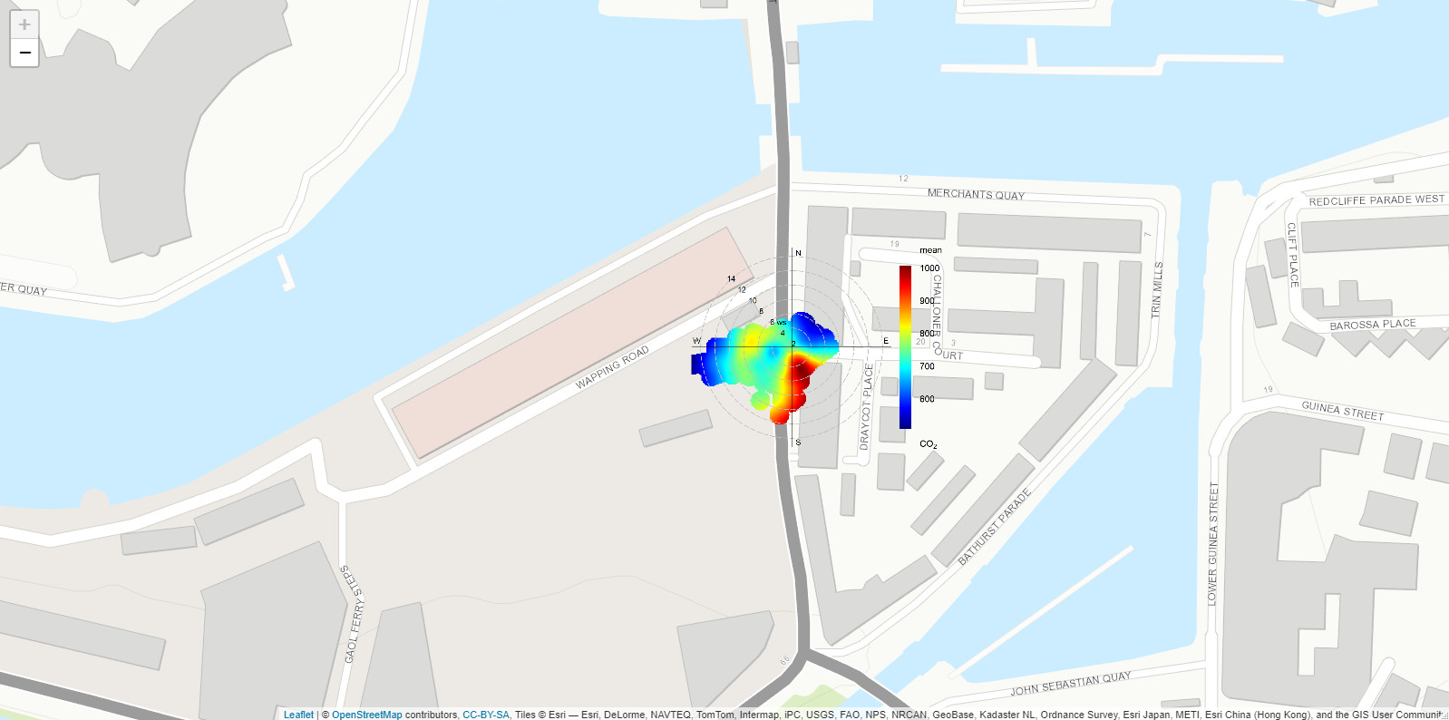
Presentation to the Manchester Open data group on some analysis I did combining citizen monitoring data with meteo data
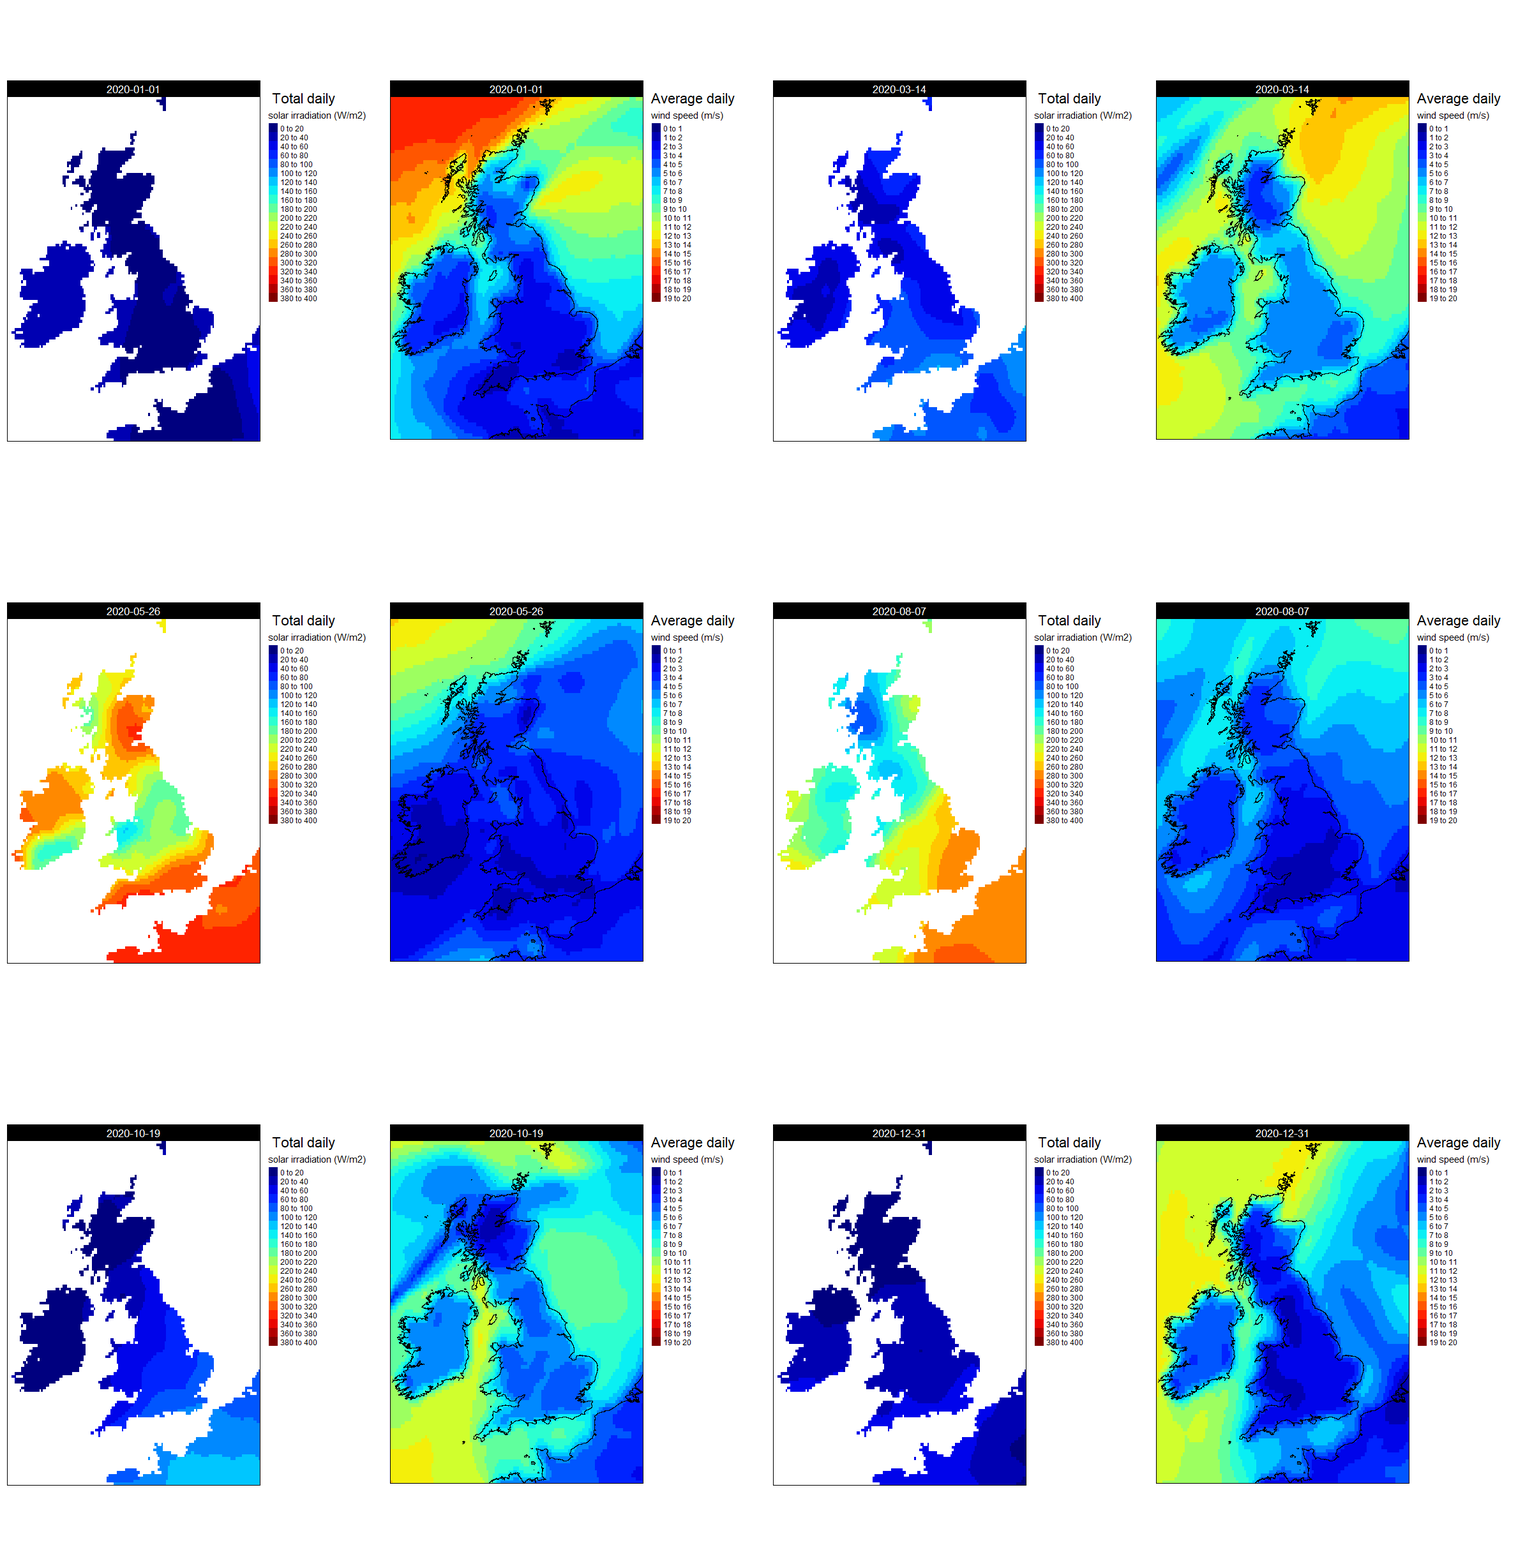
Using the ECMWF cumulative solar irradiation and average daily wind speed data, it is possible to compare daily average generation potential for any location in the world…
Writing about analysis of office conditions using BMS system data and R tools
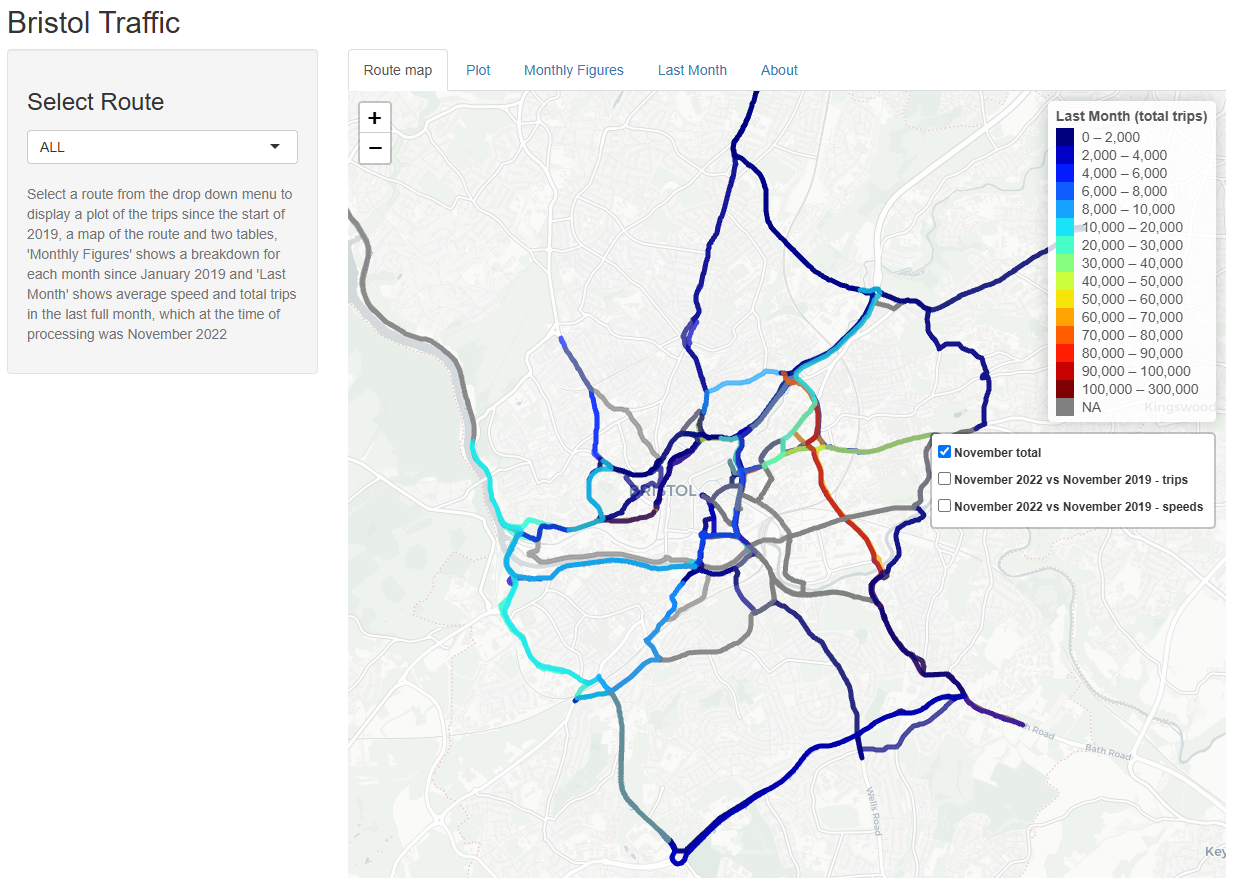
Application to interogate the open ANPR data released by Bristol City Council in 2019
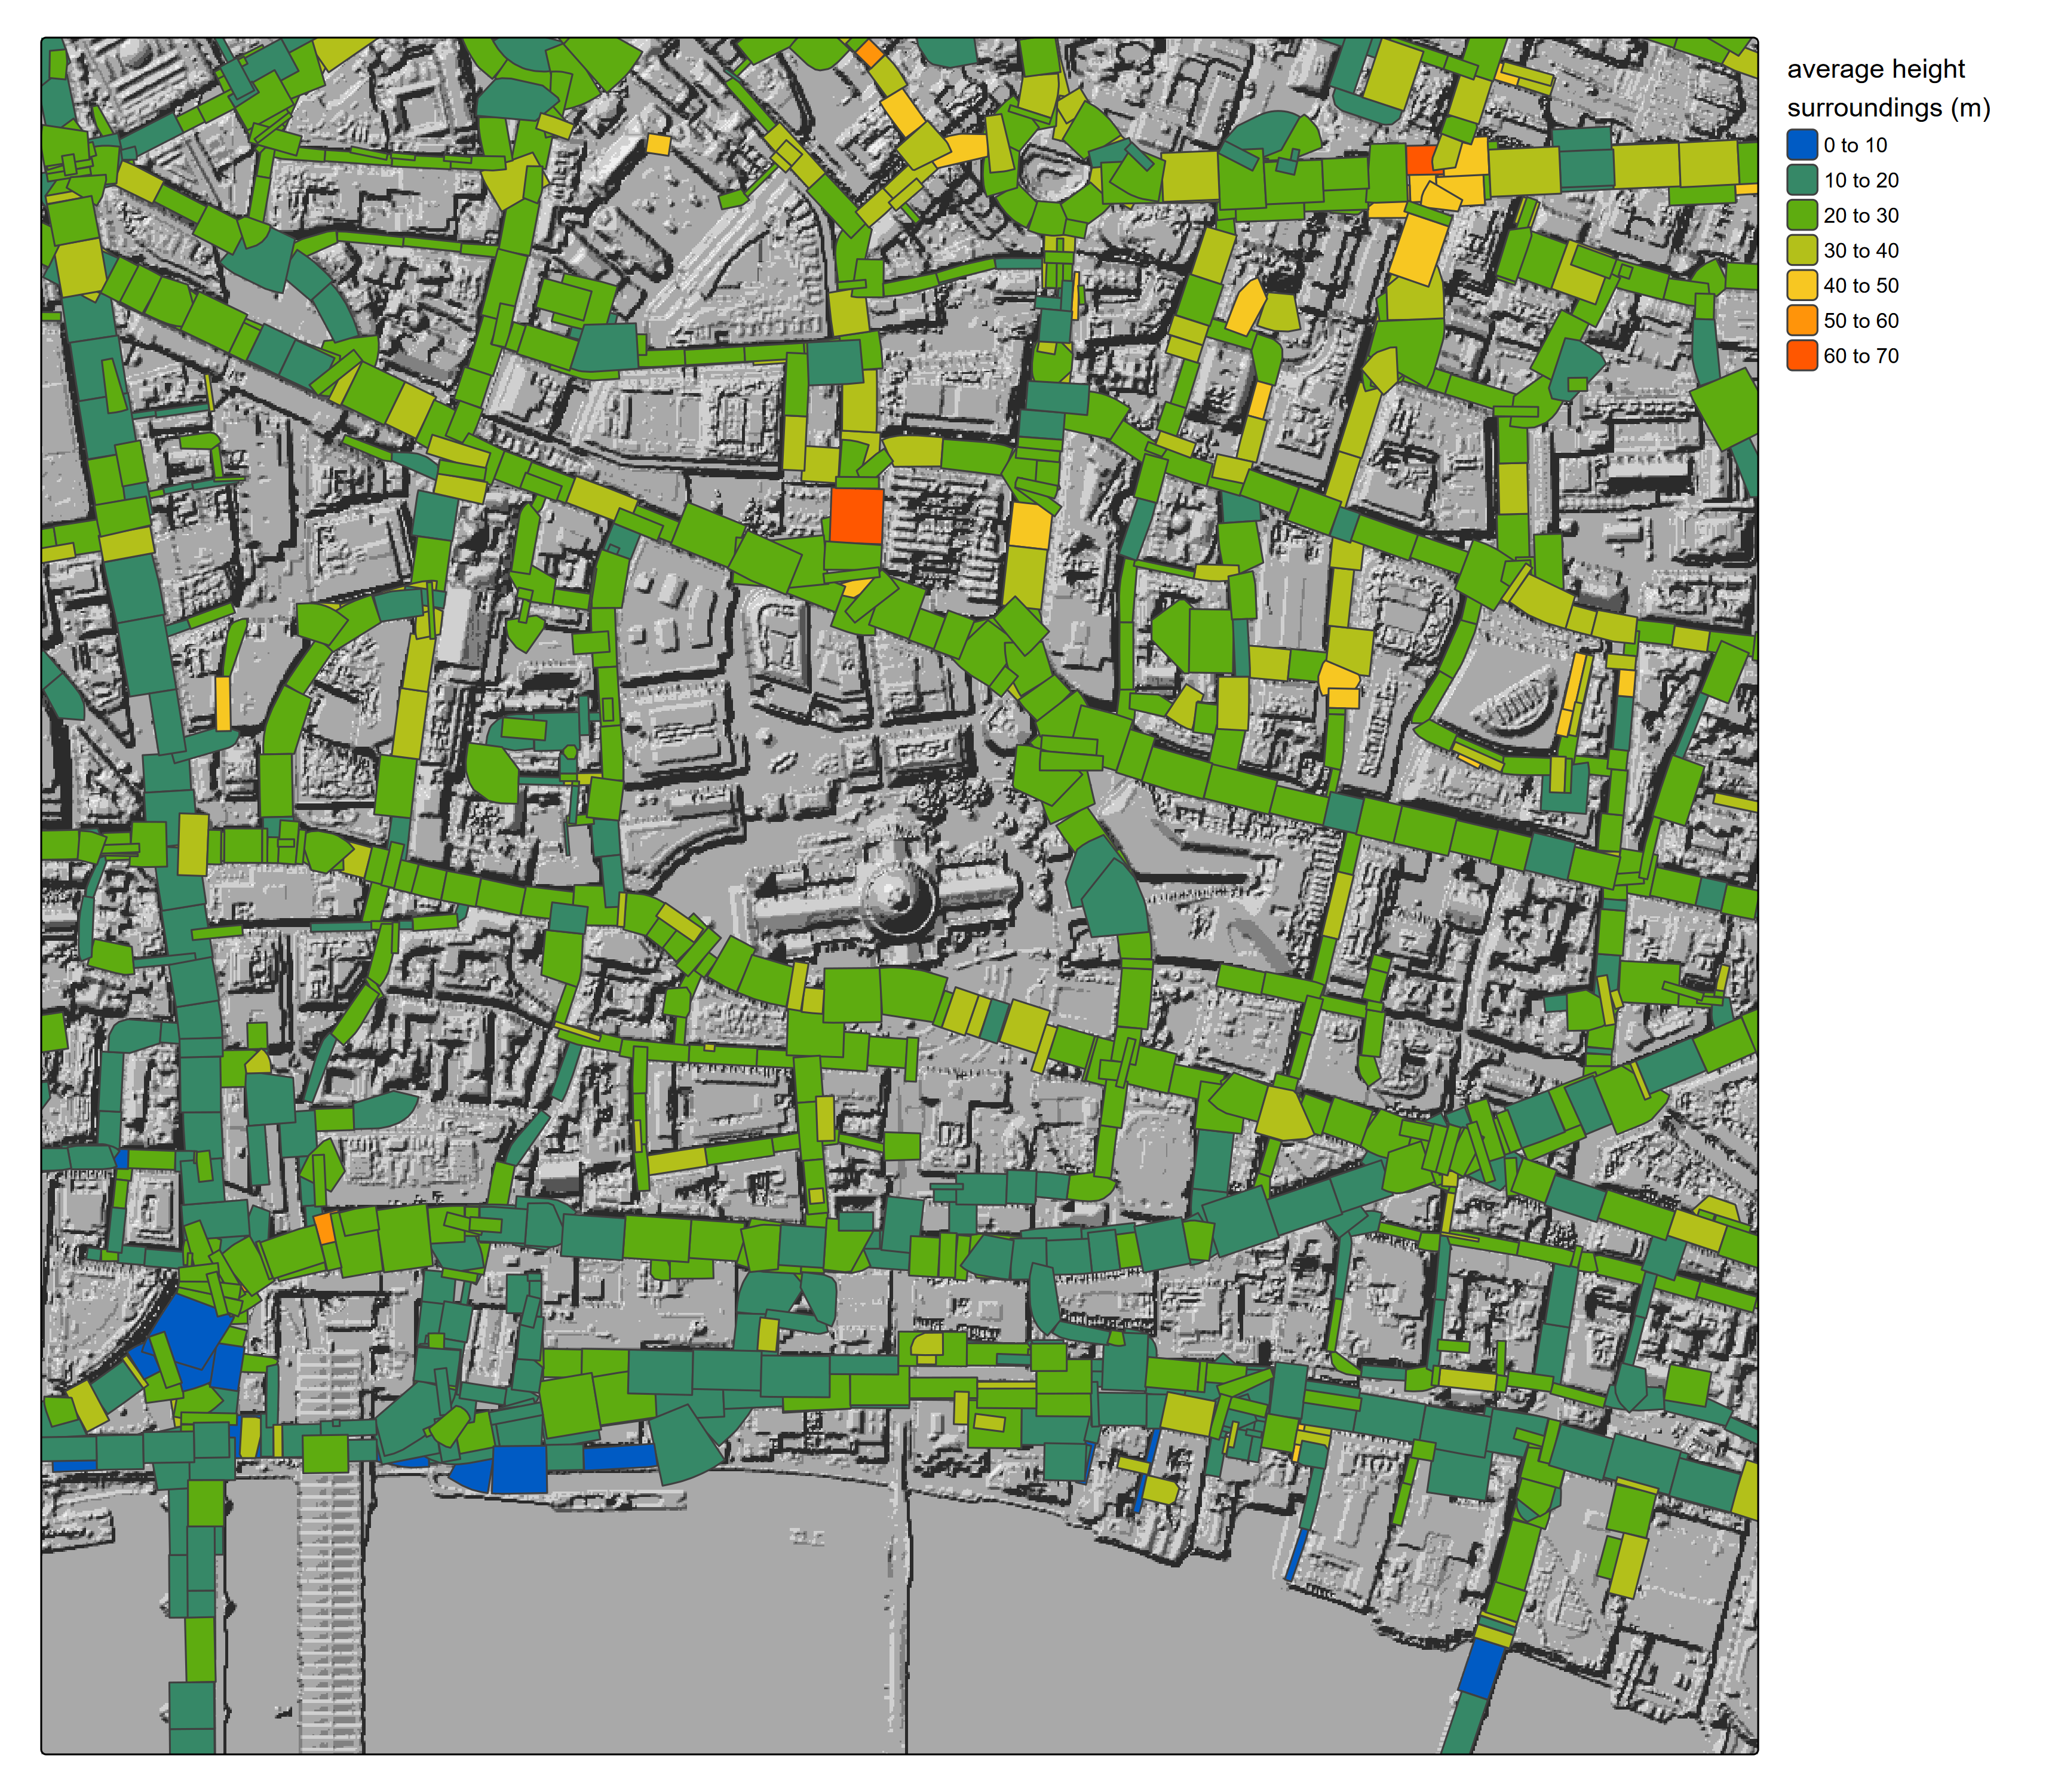
Repo showing how LIDAR data from Netherlands and UK can be used to estimate building to building distance and height.